

The Collated Ladder takes in two inputs:
- The projected number of wins for each club from the Stocky
- The projected number of wins for each club from Pythagorean expectations
Put simply, the Collated Ladder is an average of these two numbers, with a 2:1 weighting towards the output of the Stocky, rounded to the nearest whole number.
The Ladder is then based on sorting each team by its Collated number of wins, then by its Pythagoras projection, which is a loose analogue for for-and-against (the greater the number of wins projected, the better the team’s for-and-against will be).
Why bother with this if both systems have limitations and inaccuracies? Aren’t we just compounding that?
Surprisingly, this is more accurate than either of the two methods alone. Balancing them gets a lower rate of errors than the individual parts. Here’s the proof:
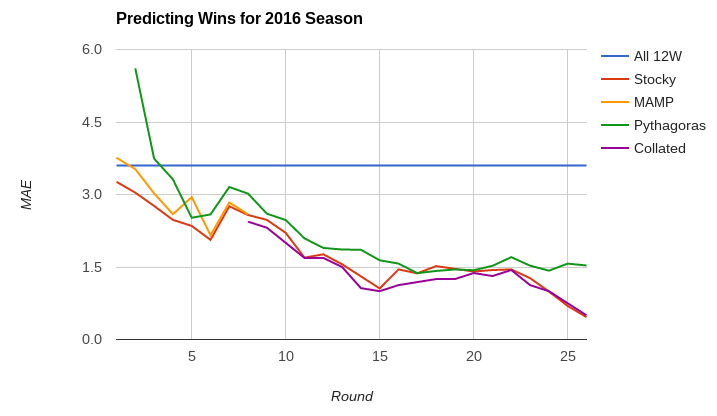
Remember that the MAE is the mean absolute error – the average of the differences between each clubs’ actual wins against their projected wins. I’ve plotted this calculated after each round of the season. We get closer to the right result, i.e. the MAE goes down, as we get more information (results of games). Pythagoras reaches a limit of 5-6% accuracy and plateaus but the Stocky gets more and more accurate because there’s fewer and fewer possible outcomes later in the year compared to the start and its clearer which are the more likely.
I think the superior accuracy of the Collated Ladder is due to using two different methods of projecting the number of wins which use different sources of information. Put together, the two systems temper each other’s weaknesses and make a marginal gain towards accuracy.
(Or it could just be a fluke of the 2016 season – we’ll see in September this year)
