

“He’s not worth a million a year!”
-NRL Twitter proverb
The trick in any sport is spending your available bankroll wisely. Soccernomics established that good soccer managers, among other things, bought players low and sold them high and that was at the heart of prolonged success. Moneyball was a two hour long movie with Brad Pitt about signing otherwise valuable players that the market had skipped over. We see that same principle at work in salary capped leagues too, whether it be the New England Patriots, the Melbourne Storm or the Sydney Roosters.
The NRL’s recent increase of salary cap has minted a number of millionaire rugby league players. There is a distinct element in the rugby league fanbase that can’t wrap their heads around players being worth those kinds of dollars.
But they are.
Let’s frame the problem. The salary cap is $10 million, give or take. That has to cover a roster of thirty players. The minimum wage is $100,000 per year, meaning that your minimum outlay is $3 million per annum (there is a salary floor, which is higher, but not really relevant). The cap functions in a more complex fashion than this but I’m trying to keep numbers round.
My contention is that a team of fringe first graders/top reserve graders would win two games in a season in the NRL. If you don’t believe me, here’s a list of players who worked their way out of Queensland Cup in 2017 or 2018: Brandon Smith, Matt Lodge, Jai Arrow, Payne Haas, Scott Drinkwater, Jahrome Hughes. You’ll be familiar with Harry Grant, Nicho Hynes, Edene Gebbie and Ethan Bullemor before long too.
That means that a team of guys who are worth the league minimum should win two games. All NRL premiership winners so far have come from the top four and an average of 15.0 wins is required to get this far up the ladder. The premiership winners themselves have averaged 16.9 wins. A reasonable target to put your team in contention is then sixteen, or fourteen wins more than a squad of fringe first graders.
The fringe first graders will cost you $3 million, so you need to spend $7 million to upgrade the squad to add enough talent to add on another fourteen games. In other words, each win above reserve grade is worth about half a million dollars in salary.
How do we identify which players are going to bring wins and pay them accordingly?
I use a metric called production. Production is basically the sum of getting the ball down the field, scoring or creating tries and not stuffing up. It doesn’t measure defensive capabilities well and misses intangibles that counting statistics don’t pick up. For example, the value of Cameron Smith and Cooper Cronk in 2019 is in yelling at teammates to get them organised, rather than actually doing anything with the ball, which is quite a rare skill. Production correlates well with overall win percentage but there are many ways to skin that cat.
A player who generates an average amount of production at that position is given a rating of .100. This is called Production Per Game or PPG. A player that is 10% more productive than average is given a rating of .110. A player 20% below, .080 and so on. Note that I’m not saying better: it’s about what players does that can be counted.
If you follow my weekly tips, you’ll see a team metric called xPPG. This attempts to estimate the amount of production we’ll see out of the team based on the players named. I recently put in the work to develop a relationship between two team’s xPPG and their respective likelihood of winning.
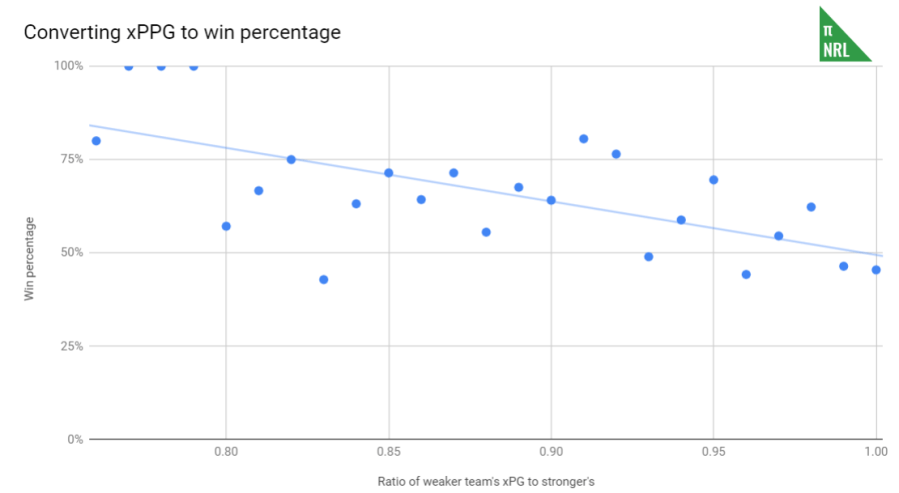
That light blue line is doing the heavy lifting and it has a coefficient of correlation of 0.40. Important to remember that this is not a super tight relationship, so anything downstream is going have some (unstipulated) error margins added.
We now have a means to rate the contribution to wins made by a player and a way to directly connect that to winning percentage. It should be clear how this relates to our initial problem but let’s look at Manly.
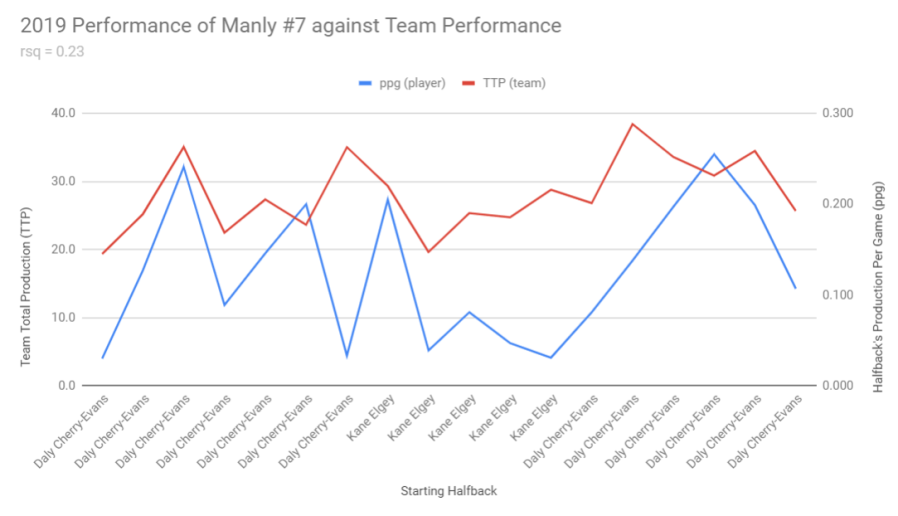
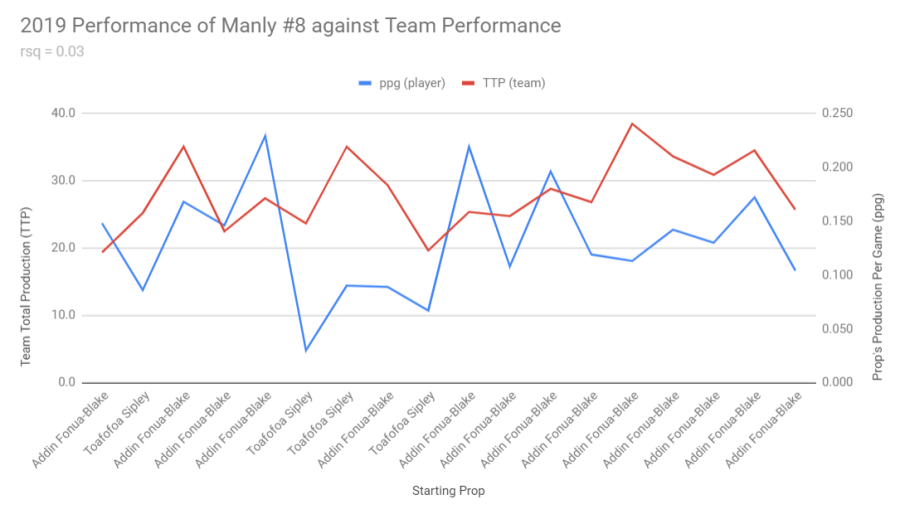
Manly shouldn’t have been a premiership contender, no matter how remote their current chances are, with their 2019 roster. At the time of writing, there’s only twelve players in the league rated at .140 or higher. Three play at Manly, the most of any team in the NRL. They are Tom Trbojevic (.163), Daly Cherry-Evans (.142) and Addin Fonua-Blake (.149). At various points in the year, they’ve missed games for suspensions, representative selections or injuries and been replaced by Brendan Elliot (.065) at 1, Kane Elgey (.081) at 7 and Toafofoa Sipley (.068) at 8.
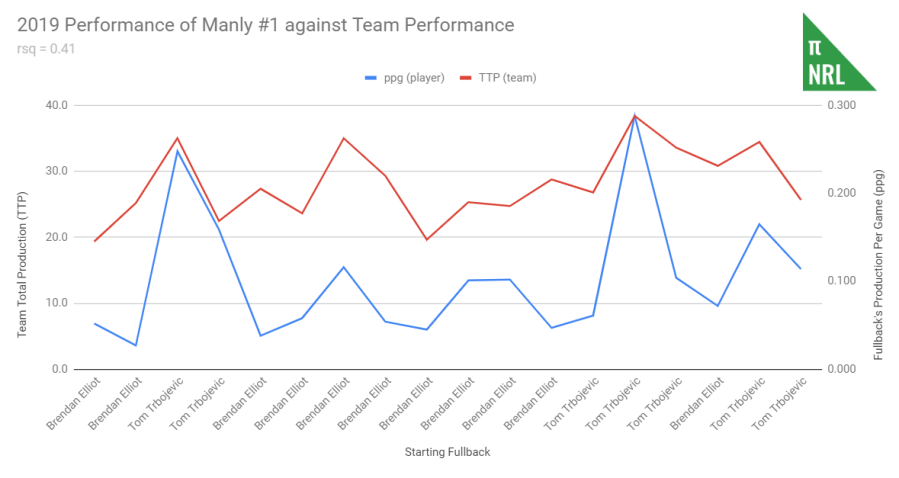
Out of this triumvirate, the team’s performance is most tightly correlated to Trbojevic’s production. Although this may be a coincidence of small sample size but more likely reflects the fact that the average fullback contributes more to production than any other position (2.46 for fullback, 2.08 for halfback, 1.85 for prop compared to 27.6 in total for an average NRL team).
The team’s performance has suffered in each case when the fringe first grader has stepped in for the star:
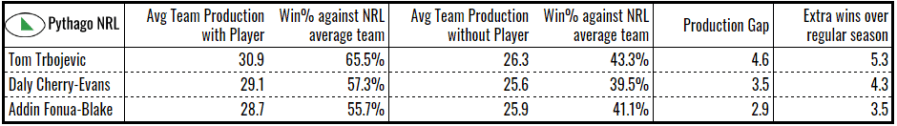
In each player’s case, the team’s production with them in the team puts them above the league average and without them they’re below it. That’s the difference between making the finals and not.
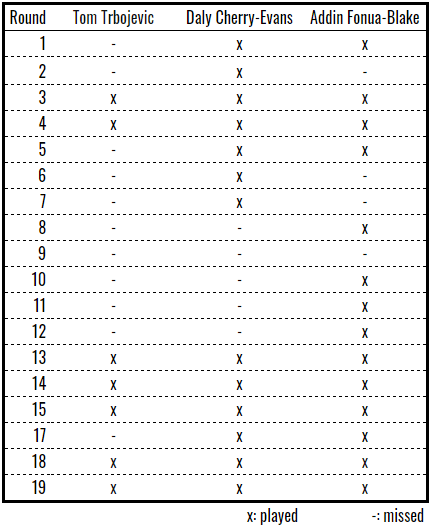
In converting between team production and expected win percentage, I’m not saying that Turbo is responsible for 5.3 wins by himself, so should be on a salary of $2.5 million. The averages shown are not independent of each other. For example, this trio has played together in seven games this year and all three missed the round 9 loss to the Broncos. Trbojevic hasn’t had a game without both Fonua-Blake and Cherry-Evans.
But we can calculate the actual production brought by the player compared to his understudy and use that as a proxy to calculate their part of the additional wins they could be credited with.
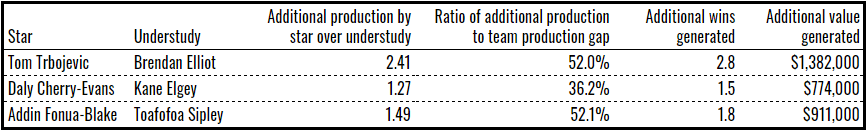
I probably shouldn’t put the value in dollar terms, mostly because people’s minds melt when you convert abstract concepts into money, but it does get to the thrust of my post. Tom Trbojevic has added about $1.3 million of value over Brendan Elliot, who should be on a minimum wage but probably isn’t. Should he be paid accordingly?
Well, no.
For a start, we’re assuming the logic and data all holds up and there are admittedly wobbly bits in the structure (e.g. there are a myriad ways to approach this problem, including much more rigorous approaches, which would generate different answers, depending on what you value). We’re also projecting eight games of performance to cover a whole season, so Trbojevic merely has the capacity to add that value but hasn’t actually done so.
It’s questionable whether he would be able to maintain this pace over a season, let alone multiple years. The top fullback over the last six years has averaged .142. Trbojevic is another level higher this year but unlikely to be able to repeat this again in 2020. It would be silly to sign him up for $1.5 million based on eight games.
Still, it’s clear to me that players out there can generate a million dollars worth of value. If Trbojevic was able to maintain .140, as he did in 2017, that’s still worth two wins and a million bucks to this Manly team. There’s probably more players capable of that than you think.
