
There was a remark on Twitter a while back that Mitchell Moses had left Wests because he wanted to play finals footy but had chosen to go to the only club that had been without a final appearance longer than the Tigers. That didn’t seem right but I looked into it and it was true.
That got me thinking. How often do teams turn up to the finals? Some, like the Storm and Cowboys, seem to be regular fixtures but how do the rest fare?
Warning: this is going to be one of those “Well, yeah, I knew that” type posts. This is not about showing off some fancy analysis, just a bit of curiosity.
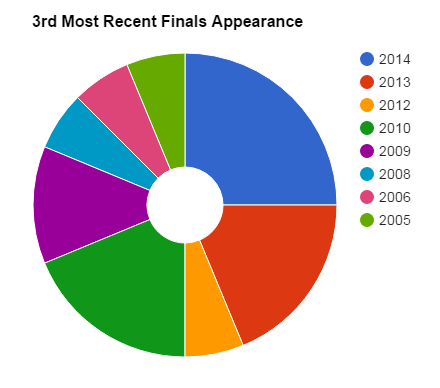
Double warning: Pie charts ahead.
Case in point, let’s look at the breakdown of the most recent finals appearances. Obviously, half of the team played in last year’s final series because it’s the same sixteen sides and the top half play finals football. Eleven clubs in total have been in one of the last two finals series and there are a couple of outliers, specifically Wests, Parra and NZ, who haven’t played in the finals for at least five years.

One of the truly remarkable aspects of rugby league is how unpredictable it is. But yet, at least half of the NRL have played in two of the last three finals series and five of the teams that finished top eight last year also finished top eight in 2015. Every team except Parramatta has had at least two appearances since 2010.

Still at least seven clubs have played at least three of the last four finals series and half at least three of the last five. We’re starting to see a bit of fragmentation at the bottom end with a wide spread of years for the other half, with some teams only having made three appearances since 2005-2010.
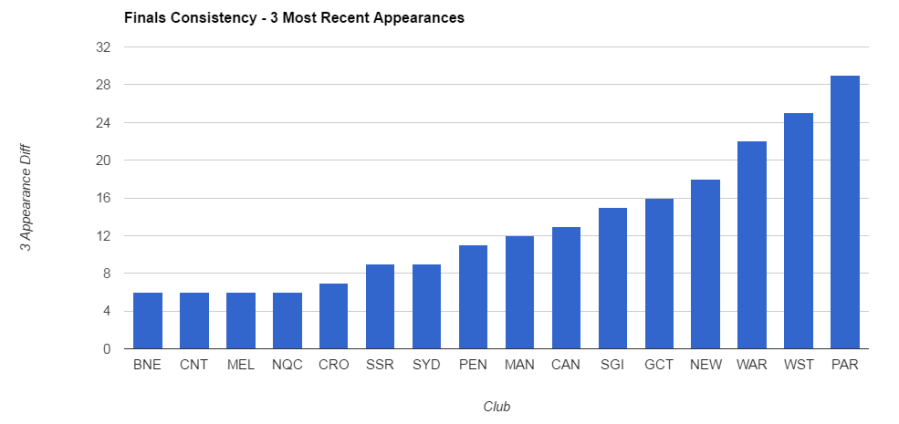
These pie charts tell us part of the picture but they don’t tell us which clubs are specifically more consistent. So for each club, I took the year of their three most recent finals appearances and deducted it from 3*2017. Let’s call this the Appearance Diff. For example, the Dragons’ Appearance Diff is 15 after appearing in the 2015, 2011 and 2010 finals series (2017*3 – 2015 – 2011 – 2010 = 15). A low Appearance Diff indicates that the club as been more successful more recently at making finals.
For the last three appearances, the lowest possible score is 6, meaning that the team has played in the last three finals series (2017*3 – 2016 – 2015 – 2014 = 6). There’s no upper limit. There are four clubs that have an Appearance Diff of 6 (no prizes for guessing who): Storm, Bulldogs, Broncos and Cowboys.
After that, there’s a pretty steady climb up the graph until you reach the likes of the Titans (three finals appearances since entering the comp in 2007), Newcastle (not since 2013), Warriors and Tigers (neither since 2011) and Parramatta (not since 2009).
The fourth most recent appearance is where things get interesting and we see a lot more spreading out. Seven of the sixteen have played in at least four of the last five finals series, which is an impressive level of consistency for those teams. That means that the other nine have really struggled to make a regular impact, with two clubs having only made three finals appearances since the NRL began in 1998.

That intrigued me a little so I wanted to go back far enough that every team had missed at least one finals series in the set. This meant going back for at least six appearances to 2010 when both Melbourne and North Queensland missed the finals, coincidentally finishing in the bottom two spots on the ladder that year, having been in the top eight every year since. Prior to that, Melbourne were in the 2009 series and North Queensland in 2007.
I’ve tabulated an Appearance Diff for the seven most recent appearances in the same manner as I did for three. The Gold Coast were dropped from this analysis at this point. The multitude of clubs that called Goldy home from 1988 to 1999 yielded one appearance in the split competitions of 1997. I wasn’t quite sure how to fill in the remaining three spots.
At one end of the graph, we see the consistent performers, including the Storm and Cowboys (obviously) but also the Bulldogs, Broncos and Sea Eagles, who have had all seven appearances in the last ten years.
In the mid tier of consistency, there’s the Sharks, Roosters, Dragons and Raiders, who made the seven since 2002-2005 and have had three or four appearances this decade. Parramatta, Newcastle and NZ have all had their seven since 2000, they’ve just been really spread over the period and haven’t had much luck recently with none of those three appearing since 2013.
For the Panthers, Rabbits and Tigers I had to dig back well into the twentieth century to find their seventh most recent appearance. Panthers were 1997, Tigers were 1990 (I included Western Suburbs and Balmain appearances) and Souths were 1987. Of course, as you go further back, making the finals was harder: the NSWRL only took the top five from sixteen teams in 1994 as opposed to the top ten from twenty clubs that played in the finals in 1998.

When you look at some of these stats, e.g. Souths absence from finals football between 1989 and 2007 and Parramatta’s absence since 2009, it’s truly amazing that the clubs managed to survive and a real testament to their fanbase for hanging in there through the lean years. The fact that those two clubs have the second and third largest memberships in the NRL defies belief.
Some of them must just enjoy the pain.
If you’re interested, here’s all of the finals appearances collated into a table. Note: the Chargers’ appearance is highlighted in purple, Balmain’s in orange and Western Suburbs’ in grey.

