

While the recent RLWC was on, I couldn’t help but notice that the RLIF had Scotland pegged as the world’s fourth best team. Scotland hadn’t won a game since 2014 and even that was against Ireland. Since then, they’d lost to Australia, England, Ireland, Wales and France. I also got frustrated because a fifteen second Google didn’t reveal how the rankings are actually calculated.
So I figured I could come up with a better system. I did and this is how the Pythago World Rankings (PWR) work.
A brief Elo refresher
An Elo rating is a number assigned to a competitor in a two player game or sport. It is intended to represent the skill of the player in question, with a higher rating denoting more skill, and moves in response to results, typically going up for wins and down for losses and moving faster or slower depending on the importance assigned to the result. Ratings go up for the winner by the same amount as they go down for the loser.
This site uses Elo ratings to evaluate rugby league teams and this particular Elo rating system is for ranking international men’s rugby league teams.
Features of this Elo rating system
- I started with all the international matches on the excellent rugbyleagueproject.org
- I eliminated all the combo/lower tier rep teams (e.g. Australasia, England Knights) and bundled others (e.g. Australian PM’s XIII) under the main country. There are thirty-four nations plus Great Britain with a rating.
- Matches are divided into “Tests” or “Other” by whatever criteria RLP use, with tests twice as important. World Cups from 1995 onwards are worth twice as much again.
- Ratings are calculated on a margin basis. For example, in the 2017 grand final, the system had the expected margin at 21 points in Australia’s favour. More than that and Australia’s rating would go up, less and England would benefit. The narrow 6-0 loss increased England’s rating by 24 points at Australia’s expense.
- Australia, NZ, GB, England, Wales and France all started on 1500. Other nations started on 1250.
- A minimum of 10 games are required to earn a rank. Nineteen teams are ranked.
Rankings
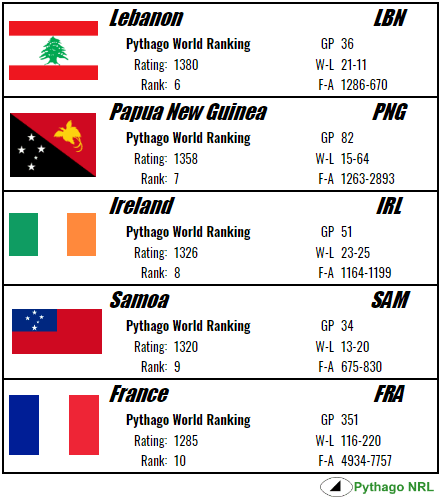
Here are the rankings as at the end of the 2017 Rugby League World Cup:

A full listing of the rankings can be found on the Ratings page. It will be updated from time-to-time, depending on the frequency of internationals and whether RLP.org do any major updates.
And the nation-by-nation results in the dataset, sorted by winning percentage:

Trivia
- Thirty-four nations have played but only nineteen are ranked based on 1191 matches from 1908 until the end of 2017. This is obviously not every single international rugby league fixture that has ever been played; I’m relying on RLP’s listings which are not complete.
- The current Pythago World Rankings are not too dissimilar to the RLIF update after the World Cup. The top five is the same but you can’t tell me Scotland (7th on RLIF) is better than Ireland (11th), Lebanon (9th) or PNG (10th).
- Australia has been the top rated team since 1977, taking the mantle from Great Britain.
- New Zealand are rated at 1500. Their 385 game, 110 year history has led them back to where they started.
- Three nations – Greece, Malta and Philippines – are undefeated in the dataset. Greece are 3-0 against Vanuatu, Hungary and Serbia. Six teams have not recorded a win, including Niue, Solomon Islands, Denmark, Canada, Ukraine and Hungary. None are ranked.
- The current average rating, unlike the NRL Elo systems, is 1293 for all thirty-four countries and 1321 if you include only ranked countries.
