

Elo ratings originated in chess as a way to rate different players. A player starts with a rating of 1500 by convention and then the rating goes up or down depending on whether the players wins or loses. The player’s rating will change proportionally to the rating of their opponent: if the player beats a very highly rated opponent, the player’s rating will go up by more than if they beat a minnow.
This rating system has been adapted for soccer, NFL, AFL and a few systems have been developed for rugby league teams (1, 2 & there was a third but it seems to have gone missing). What intrigued me was how The Arc and 538.com were able to take Elo ratings and, instead of just ranking teams, were able to predict the outcome of matches in advance with a surprising degree of accuracy. I decided that I wanted to try the same thing for the NRL.
Here’s the soccer explanation for how it’s calculated:
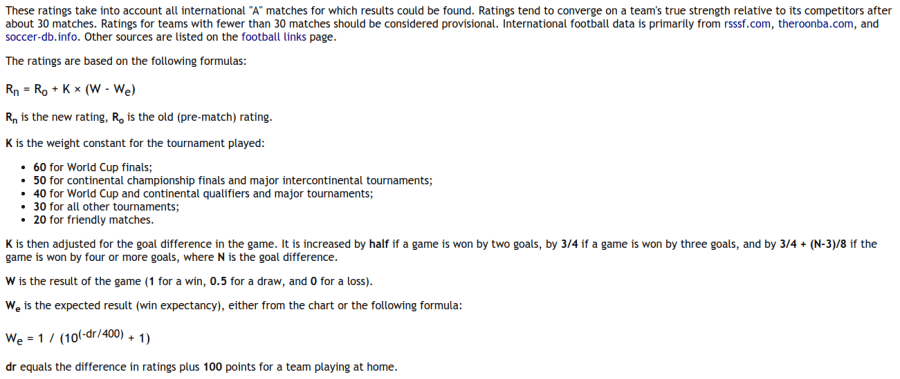
The basic elements are these: the team’s new rating after the match is a function of the team’s rating prior to the match (Ro), the weighting put on the match (K), the result (W) and the expected outcome (We). The expected outcome is itself a function of the difference in the two teams’ ratings (dr), which is modified to account for a home field advantage.
Let’s work through an example. It’s round 5 of the 1998 season and the Adelaide Rams are playing host to the Gold Coast Chargers. Coming into the game, Adelaide are rated 1488 and the Gold Coast 1477, both a little below the average of 1500. On neutral territory, Adelaide would be favoured slightly to win.
In one of the Elo rating systems that I’ve been working on, the homefield advantage is worth 48.2 rating points and a regular season game has a K value of 12 which will not be adjusted by the margin. Applying the homefield advantage, Adelaide is now 1512 and Gold Coast 1453 (24 rating points added to the Rams, 24 points taken off GC).
The difference between the two teams is 60 points. Using the soccer win expectancy formula above, the odds of Adelaide winning the game is given as 58.5%.
Adelaide would go on to lose this game (it wouldn’t be the last), with the Chargers scoring 16-8.
If we use the same format of (W-We) as in soccer, Adelaide are re-rated as follows:
Rn = Ro + K*(W-We)
Rn = 1488 + 12*(0 – 0.585)
Rn = 1481
Meanwhile, the Gold Coast’s rating would improve by the same number of points that Adelaide’s decreased, rising from 1477 to 1484.
This is a basic example to demonstrate the calculation process. How and why we pick certain values for the variables or how we can integrate the impact of different margins will discussed in another primer.
The takeaway message is that the Elo rating system is a way of rating teams, developing predictions for the outcomes of games and then re-rating teams based on their performance.
See also: How do Elo models work? and What variables do the Elo models use?
