

If you’re wired for numbers, like I am, it can be hard to deal with people’s feelings and understanding why they think the things that they do. That’s why I’ve decided to quantify the feelings a team generates into five distinct indices: Power, Hope, Panic, Fortune and Disappointment.
Each index has two components. There’s a main mechanism for ranking the teams and some minor tie-breaking stats. The main mechanism typically uses Elo ratings to make an estimation of what we expect from a team, whether or not they are meeting that expectation and what that means for the season ahead. The tie-breakers are statistics used to award a few points here and there to help rank the teams should they have similar mechanism results.
Editor’s note: As much of last season’s material was influenced by The Arc, much of this season’s material owes a debt to SB Nation, including the idea of panic/hope indices.
Power
Yes, this is the old Collated Ladder. The rating is the same as collated wins: one-third Pythagoras, two-thirds Stocky and rounded off. This is essentially a predicted number of wins that the team will manage based on their performances to date. More powerful teams will win more games and feature at the top end of the index.
We also compare the rating (un-rounded) to the number of wins picked up, on average, by the team finishing first, eighth and sixteenth, as well as showing the team’s chances at winning the minor premiership according to the Stocky. Here’s the Power Index from the end of the 2017 regular season:
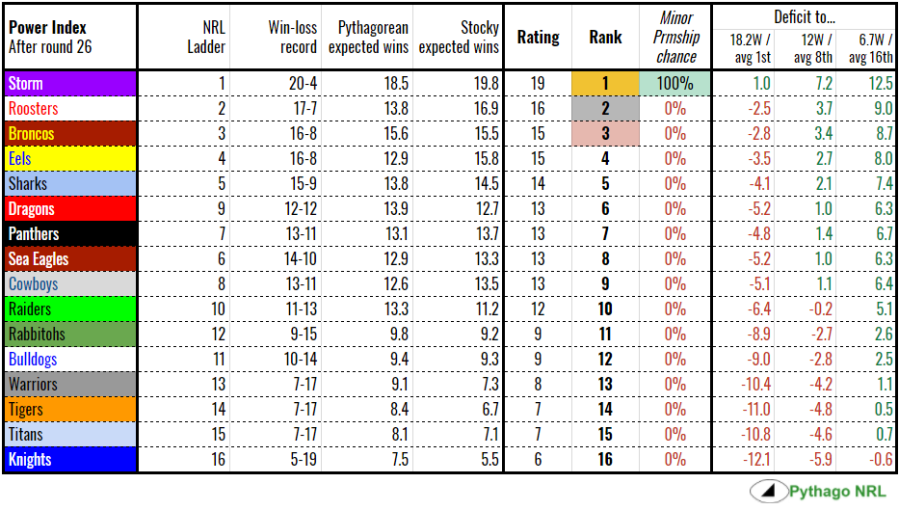
It’s not too dissimilar to the actual NRL ladder, with only a few teams changing places mid-table. With the Stocky’s input system having been tuned down a bit for this season, I would expect that we will see less dramatic changes in the ladder during the season than we did last year.
Hope
The Hope Index tries to capture the feeling that your perhaps-a-bit-below-average team is about to turn it around and make a charge. The main mechanism is to look at a team’s last five games. Using their average odds as calculated by their form Elo ratings (Archimedes), we can calculate a “degree of difficulty” for those games. Teams on form with high ratings – Storm, Broncos, Eels – will have a low difficulty because they are more likely to win games and have an easier time of it. Lower performing teams with lower ratings – Knights, Titans, Warriors – have higher degrees of difficulty because their games looked comparatively harder (less likely) for them to win.
The degree of difficulty is multiplied by the number of wins over the last five games. More wins means more hope. More difficult wins means more hope still, as it seems like things might be turning around, claiming a few bigger scalps. Tie breakers are awarded to upset wins (winning a game after starting with less than 40% chance of victory) and close losses (six or less points). We also show the chance each team has of making the finals as computed by the Stocky.
The higher the hope rating, the better the team’s future is looking. Here’s the Hope Index from the end of the 2017 regular season:
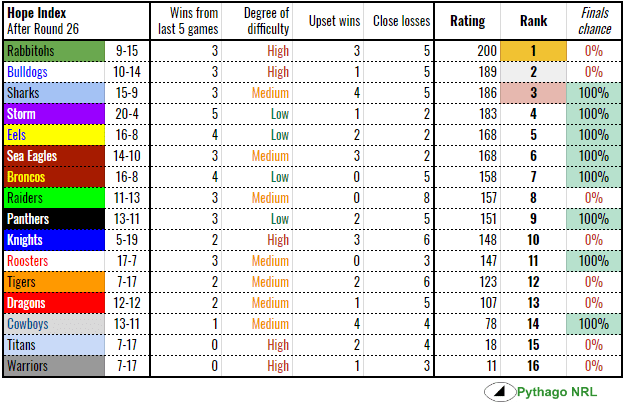
Souths and Canterbury, each picking up three of their handful of wins in the last five games of the season, are the top two the Hope Index. This perhaps offers a glimpse of what might be possible next year or it could be garbage time wins against teams that had given up. The Sharks, gaming the system a little, were in crap form immediately after Origin but managed to sling together enough of a performance to win a few games against what seemed like superior opposition in the closing stages of 2017.
Things were looking pretty dismal for the Cowboys with only one win from five games in the run to the post-season but as we all know, they turned it on during the finals to make to the big one. The index looks far from scientific in hindsight but at the time, it looked like they were cooked. The Titans and Warriors were literally hopeless, registering no wins in their final five games of the year, ensuring a place at the bottom of the index.
Panic
There’s a sinking feeling that sets in when your team is not as good as hoped. There’s an even worse sensation of panic when they look headed for a wooden spoon. The Panic Index sets out to put a number to that hole in your stomach.
The Panic Index looks at the team’s current rating and estimates the number of wins the team can reasonably expect in the remaining part of the season. The difference between the number of wins typically required to avoid the wooden spoon, the team’s already accumulated wins and the number expected of them are what we call “unexpected wins required…”. This is the basis of the index with one rating point added for every 50 points conceded on the field and two rating points added for each big loss (24 or more points) added as a tiebreaker. The Stocky’s reckoning of each team’s chances of finishing last is also shown.
A positive rating means panic stations, a negative rating means the team (and their supporters) should be cool, calm and collected. Here’s the Panic Index from the end of the 2017 regular season:
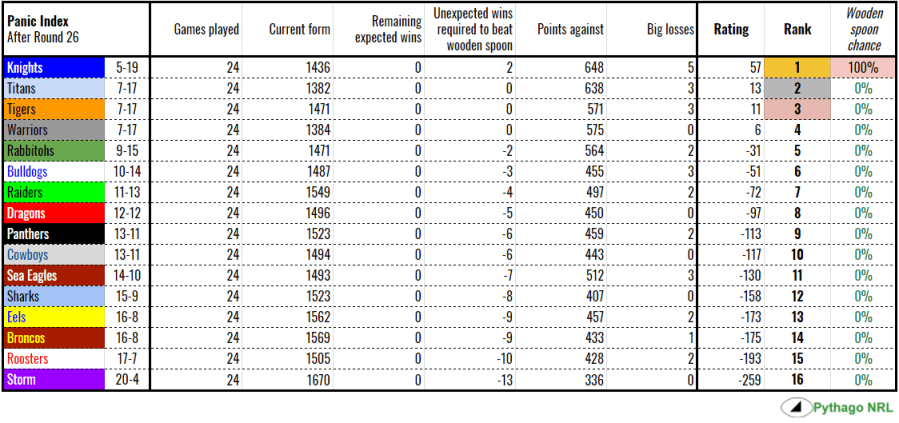
Naturally, the Knights topped out the list but the three teams that finished on seven wins were at risk of getting the wooden spoon themselves right until the death. There would have been some nerves in clubhouses in Campbelltown, Robina and Mt Smart. At the other end, the top four finishers could not have been more comfortable.
Fortune
We have Pythagorean expectations, we have Stocky outputs and we have actual on field results. Often there’s a difference between the three. If a team wins more games than Pythagoras says, did the team get lucky or was it skill? If a team doesn’t meet the expectation, did they suffer from bad luck or underperformance?
There’s something of a very complicated debate among baseball nerds that basically boils down to this idea: are the stats a reflection of the actual performance with deviations explained by randomness or are the numbers a theoretical construct with a gap to reality?
Instead of “luck” or “performance”, I prefer to think of this discrepancy as fortune, good or bad. The main mechanism here is the sum of a team’s over-/under-performance compared to their Pythagorean expectation and the wins predicted by the Stocky, expressed as difference in win percentage multiplied by 1000. The tie-breaker is the teams number of close (six or less points) wins.
A positive hope rating implies good fortune and a negative rating, bad fortune. Here’s the Fortune Index from the end of the 2017 regular season:
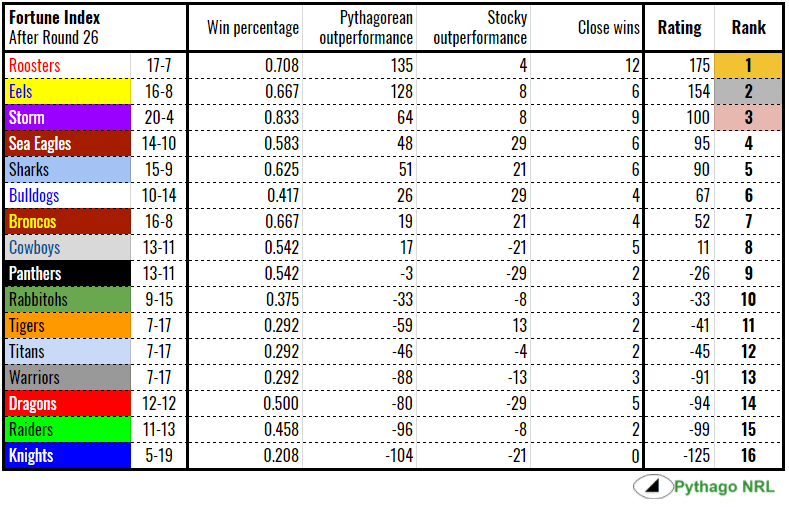
We see the Roosters and the Eels massively outperforming the expectations set by Pythagoras and thereby topping the Fortune index. Flukes or skill? The Raiders and the Dragons underperformed against both systems and expectations and duly rewarded with a low rating. Undeserved bad luck or incompetence? That’s for you to decide.
Disappointment
One of the main breakthroughs I had over the off season was that the class rating system (Eratosthenes and Hipparchus) is representative of whether we think of a team as being good or bad, if we don’t take their recent run of results into account. Generally, Melbourne and Brisbane have high class ratings and are considered good teams. Likewise, Newcastle and the Gold Coast have low ratings and are considered bad.
We can use this idea to set up expectations at the beginning of the season and then see how well the teams meet these expectations. The team’s initial class rating is used to estimate a number of wins. The actual number of wins is subtracted from the estimate to form the “Capability Gap”. Upset losses (where the team was 60% or more likely to win the game and didn’t) are used as the tie-breaker.
A positive rating means that the team has failed to live up to expectations while a negative rating means the team has done better than we thought. Here’s the Disappointment Index from the end of the 2017 regular season:

The Bunnies, still sliding down from their highs in 2014, started the season with moderate expectations of a finals appearance with thirteen wins. Nine wins later and that went out the window as they fell far enough short of their goal to take out the Disappointment Index in 2017. Note that while the Tigers, Titans and Warriors all finished with seven wins, more was expected of the Tigers due to their higher initial rating. The Raiders had a great 2016 season but were coming off a low base, so the expectations were not set as high at the start of 2017 with their class rating was around average. They still fell short of what was expected but not by as much as I thought they had. Conversely, after a shocker of a 2016 campaign, the Roosters weren’t expected to do much above finishing mid-table and managed to make it to second place, so their disappointment rating was very low.
