

With the wet start to the 2019 season, there’s discussion about the tactics and competence of teams playing the wet. The Bulldogs seem to have the best reputation for playing in the wet, although I’m not sure where this originated from. After some prompting on social media, I decided to do a bit of investigation.
https://twitter.com/me_dc/status/1106741914387116032
Over the off-season, I spent some time collecting individual match stats from the NRL website, from season 2013 through to the end of 2018. In that dataset, the NRL identified 176 games where the weather was recorded as “rain”, “showers”, “light rain” or “rain and thunder”.
There were a further 128 games where the weather was noted as “unknown” or not listed at all, which suggests that this is not a complete record of all wet weather matches over the last few years. If this subset is representative of typical weather, we might only be missing a dozen games or so.
176 games split across sixteen teams is not a huge sample size to work with, but given these caveats, here’s how each team’s record looks in the wet with their Pythagorean expectation:
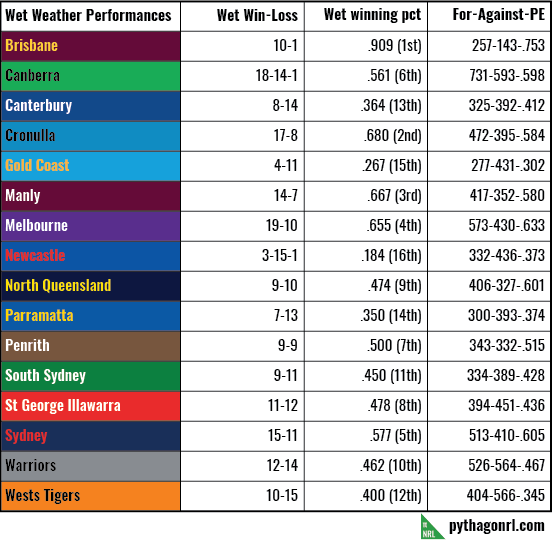
I could digress on to a discussion about how weather in south-east Queensland is different to Sydney and the obvious impacts on the game suggested but I’ll stick to the main point. And this table settles it, right? Broncos won the highest percentage of wet games, so they’re the best? But that doesn’t seem right, does it?

Take this slightly different example: the home team at Suncorp Stadium has won 61.8% of 217 NRL games played there. The home team at AAMI Park has 74.6% of their 114 games. Are these exceptionally high rates due to park factors – that is, the home crowd, travel distances, quality of playing surface – or due to the fact that the home team is usually the Broncos and Storm, respectively, and these teams are generally much better than average? Put another way, if we moved the Tigers to Melbourne, would they start winning three out of four home games or would they maintain a rate in line with their current .496 home record? The answer probably takes a little from both column A and B.
To get some context, I think it’s best to compare the wet weather winning percentage against the team’s winning percentage across all games over the same time period:
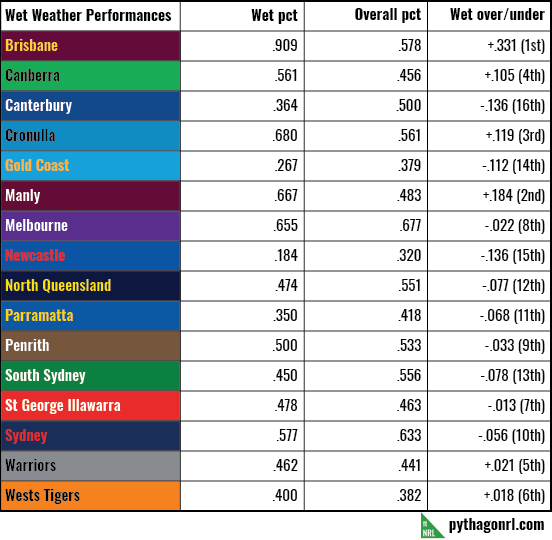
We see the Broncos still win a lot more games in the wet than they win overall. Even using Pythagorean expectation, my preferred method for filtering out some of the noise created by binary win-loss scenarios, the Broncos massively out-performed their regular level of performance.
However, most teams rank about the same in the wet and overall. The other significant divergences are Canberra, Manly and Cronulla on the upside and Gold Coast, Newcastle and Canterbury – contrary to initial expectations – on the downside are not as huge as the Broncos’.
So here’s another question for you. What are the odds of getting exactly ten heads in eleven tosses? I’ll save you digging out a binomial distribution table and tell you that it’s 0.5%. And if that coin normally returns heads 57.8% of the time, those odds increase to 1.9%. That sounds extremely unlikely but the odds of at least one team in sixteen achieving something that occurs only once in 200 attempts is actually 8%. For one in 50 attempts, that increases to 27%.
What does this all mean? I’m suggesting that a lot, not all but a lot, of wet weather performance can be explained by randomness. In a scenario like the NRL, it is unlikely but entirely possible that a team could win ten of eleven games largely by chance. The weather is a coincidental, but not irrelevant, factor.
Phil Birnbaum, a baseball analyst, did some interesting work looking how performance could be sharply different for players when splitting stats up using a completely arbitrary factor. For example, in 2004, Derek Jeter had a substantially higher batting average on odd numbered days (.325) than even (.254). Why? There is no reason, it’s just a weird quirk of the way that season played out. If you have enough players or games, weird patterns like that naturally emerge with no overarching explanation.
You might have wanted a simple answer when you clicked on the link but, with me, you’re never going to get one. The moral of the story is that humans are primed to identify patterns. We’re like hairy pigeons in that sense. The reality is that much of our surrounds, especially the game of rugby league, is a lot more noise than signal than we would like to admit. We’re naturally geared to seek out the signal and if it’s not there, we’ll fill in the gaps.
If I was building a mathematical model to represent Grand Unified Theory of Rugby League, of course I would factor in weather forecasts. It would be foolish to conclude that weather does not have an impact on the outcome of a game. By the same token, you have to be aware of drawing seemingly solid conclusions from small sample sizes and assigning undue importance to them due to their apparent certainty.
In other words, just because the Broncos win 90% of their wet games, doesn’t give them a 90% chance of winning any wet game in the future. Would you take the Broncos head-to-head at $1.10 if the only information you had about the game was that it will be raining?
Those cognitive biases can be troublesome if not managed.
