

The 1956-66 St George Dragons are often cited as the greatest rugby league dynasty of all time, especially if the author of the statement is of a particular age. Unlike most received wisdom in rugby league, this seems to be hold up pretty well from whichever angle you examine it. But what of other teams in other leagues? And of other dynasties? How do they compare?
For the purpose of this study, a dynasty is a club side that maintained a high level of success, if not outright dominance, for an extended period of time. We want to know this as a consideration in a larger argument about the greatest teams of all time. While this an argument that will not be resolved here, now or ever, it gives us something to talk about while we wait for the resumption of the football season.
We are aiming to use a relatively objective set of criteria to identify dynasties without having to use personal assessments, with all the baggage that brings. The results are what I think are reasonable, although you could and probably will argue the details. We also want to show a bit of flexibility, as the criteria used are arbitrary but most variations on this system will yield roughly the same answers.
This is not going to be the story of each dynasty, of which there are more than sixty across Sydney, Brisbane, England and Australia, and that would be better suited to a book, than a blog. However, I think there’s a lot to learn about the nature of football and how players or coaches or changes in the environment impact rugby league’s history.

The accounting system
I’ve adapted Bill James’ system for identifying baseball dynasties for the equivalent achievements in rugby league. Under the tweaked system, each team has a rolling sum of achievements from the previous three seasons. Achievements are purposely designed to set a high standard to identify great teams and are weighted as follows:
- 6 points for winning the premiership and minor premiership
- 5 points for winning the premiership only
- 4 points for winning the minor premiership but not the premiership
- 3 points for losing the grand final
- 2 points for finishing the regular season with a .800 or more winning percentage
- 1 point for finishing the regulation season with a .700 or more winning percentage
- -2 points for a winning record of less than .700
- -3 points for a losing record
In the 29 RFL seasons that did not have finals, points are awarded as follows:
- 6 points for winning the league and Challenge Cup
- 5 points for winning the league only
- 4 points for winning the Challenge Cup but not the league
- 3 points for losing the Challenge Cup grand final
Teams are awarded the points for their greatest (highest scoring) achievement in the one season. Dynasties do not continue through either World War in England, due to the switch to emergency war-time leagues through both. The shortened 1995 season, wedged in the transition from winter to summer football, is not counted as it does not have a corresponding Challenge Cup.
At a minimum, a dynasty is achieved when the rolling sum peaks at ten points or more, comprising at least one premiership and three consecutive seasons of achievements. The dynasty’s length is determined by how long the team maintains a rolling sum above zero. The end date is set by the last achievement before the ending zero and the start date is set by the first achievement around the starting zero.
Here’s the NRL-era Roosters as an example:

The dynasties are highlighted in yellow, each comprising a rolling sum that peaks at 10 or more and at least one premiership with at least three consecutive achievements. The first begins with the 2002 premiership and ends not in 2006, when the rolling sum returns to zero, but in 2004, the last achievement in the dynastic set. The second begins with the 2013 premiership/minor premiership double, as the first achievement in the dynasty, and continues to this day.
The nature of the system mean the start and end dates might be out by a year from what you would expect. Subjectively, the second Roosters dynasty could be split in to two, given the disastrous 2016 season and the subsequent changes in the roster, although I would argue that this dynasty is the work of Trent Robinson, rather than any specific players.
There also has to be a cut off somewhere, so some good-to-great teams are not identified here. The most obvious examples are back-to-back premiers, such as Sydney Easts and Brisbane Wests in the late 70s, that miss the cut for lacking three consecutive achievements, and teams that peak over 10 points but lack a premiership, such as early-to-mid 70s Warrington.
There is no means to prevent multiple dynasties arising at the same time. While the word implies singular control, the reality is that there are often multiple dynasties (or houses or warlords or whatever your preferred historical nomenclature) vying for control of a particular piece of geography at any given point in history. So it is in football, where multiple powerful clubs will battle for dominance at any given point in a league’s history. Consider a parallel between the superpowers of the Cold War and the current domination of the NRL by the Storm and Roosters.
The dynasties of rugby league
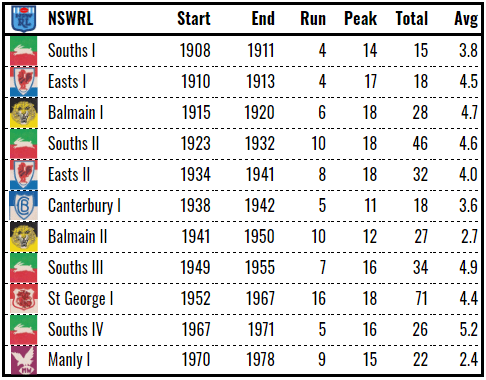
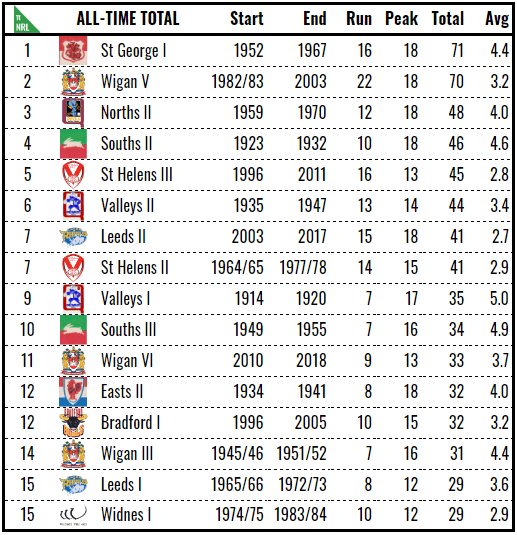
“Run” is how many seasons the dynasty lasted. “Peak” is the highest the rolling sum achieved during the dynasty (minimum 10, maximum 18). “Total” is the total number of achievement points racked up during the dynasty. “Average” is the sum divided by the run for the average number of achievement points scored per season.
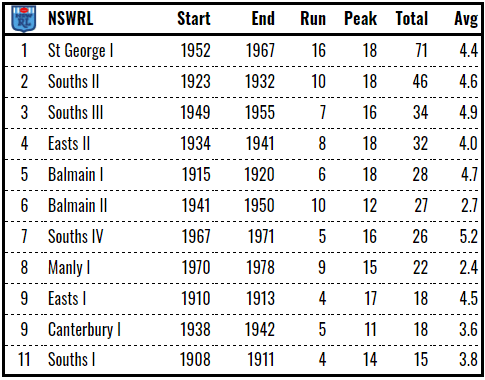
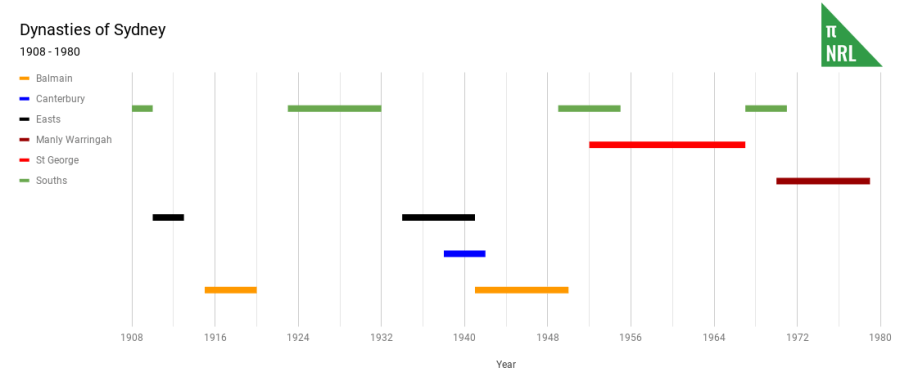
Sydney (1908 – 1981)
Dynasties ranked by total achievement points:
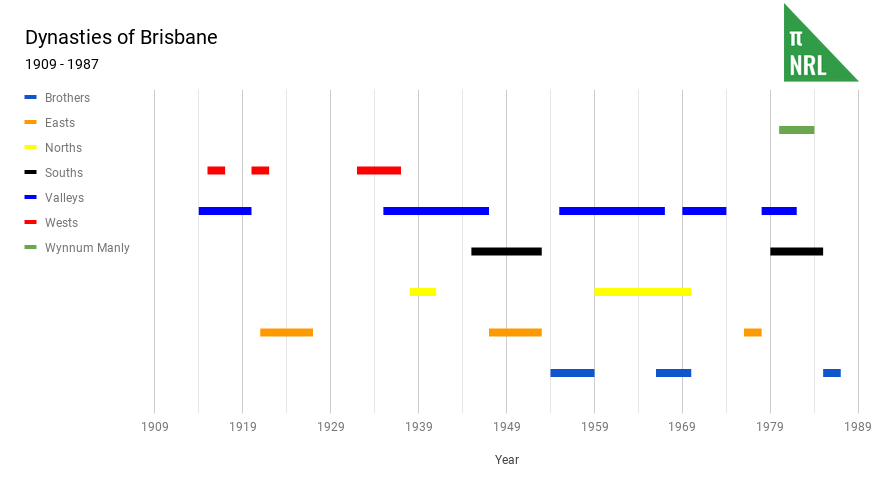
Brisbane (1909 – 1987)
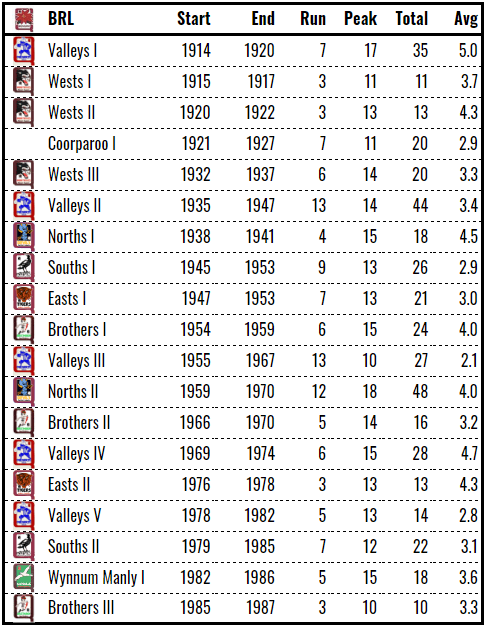
Dynasties ranked by total achievement points:
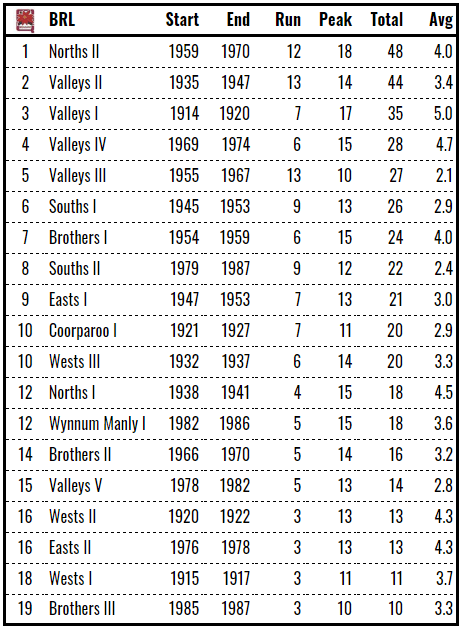
*Coorparoo has been shown as an Easts dynasty
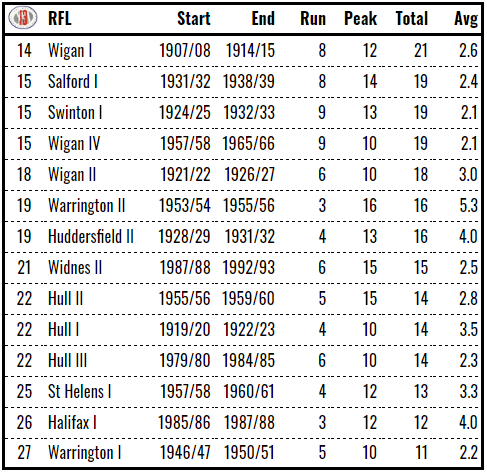
England (1901/02 – 2019)
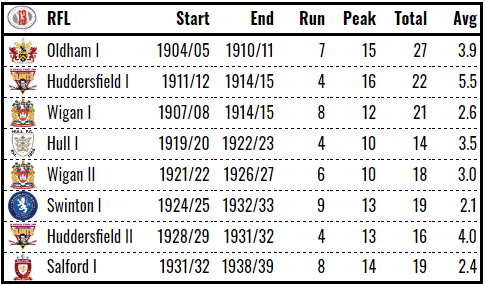
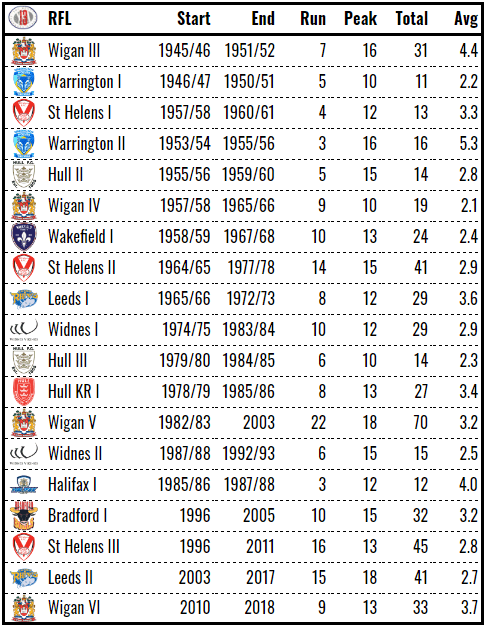
Dynasties ranked by total achievement points:


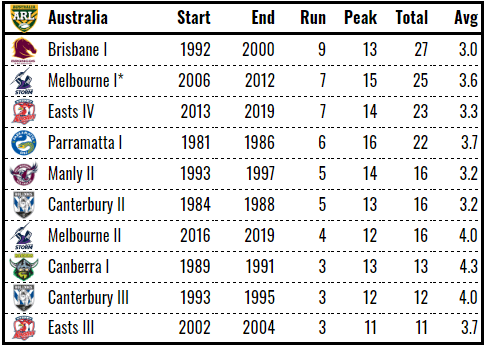
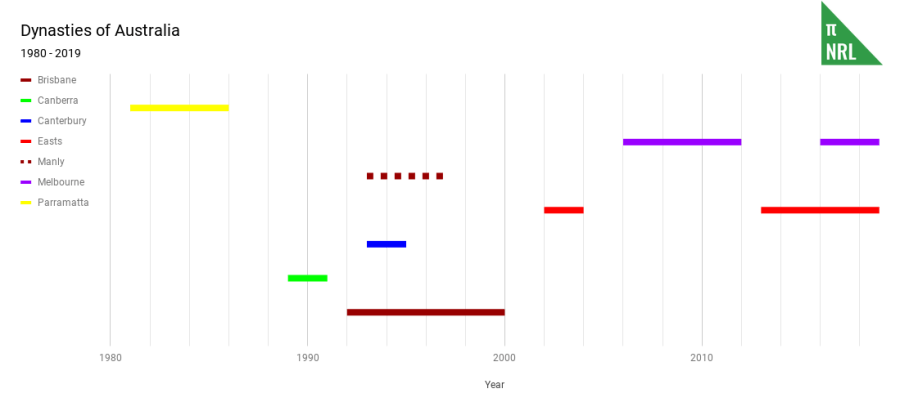
Australia (1982 – 2019)
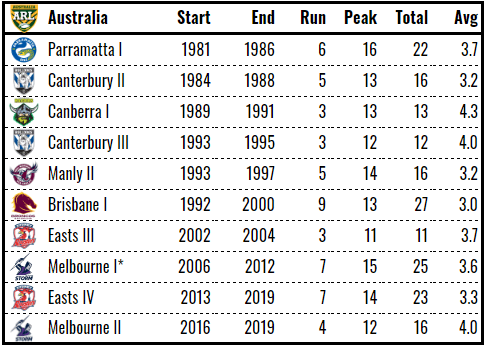
Dynasties ranked by total achievement points:
All-time dynasties
Dynasties ranked by total achievement points:
Dynasties ranked by peak achievement points:
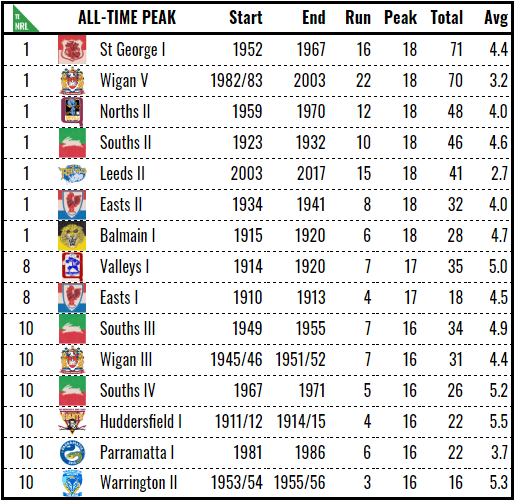
The greatest clubs are those that peak at 18, the maximum, meaning back-to-back-to-back doubles.
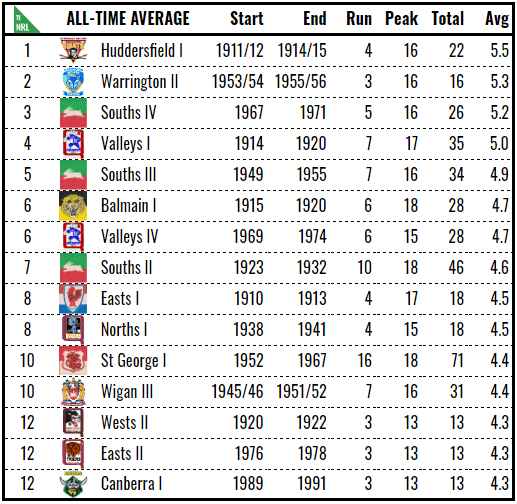
Dynasties ranked by average achievement points:
Greatest clubs
Clubs ranked by total achievement points accumulated during dynastic seasons:
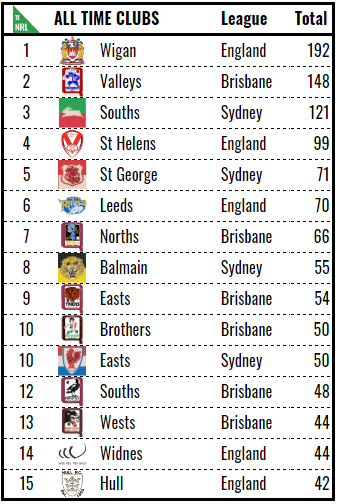
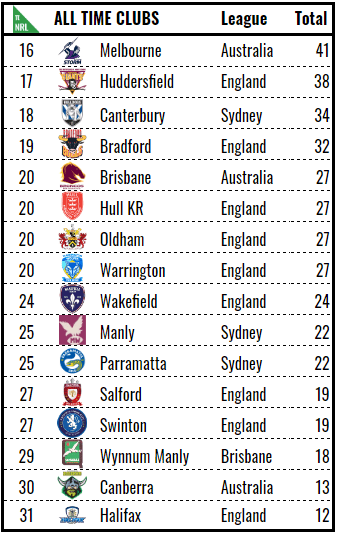
*Coorparoo I is included in Brisbane Easts’ tally
Around the leagues
Of the 32 BRL clubs, 33 NSWRL/ARL/NRL clubs and 68 clubs to pass through the RFL’s top flight, 133 in total, only 31 ever managed to string together enough success in 120 years of football to be called dynasties. Obviously, a number of clubs didn’t play for very long, let alone achieve success. Many of the BRL clubs played one or two seasons in the 1910s and 1920s before disappearing, like Natives, Railways and Ipswich Starlights. The clubs that we are left with have been through a rigorous process of natural selection to be alive at this point in time. That is, of course, no guarantee of future survival.
Only seven of the twelve teams that were in the NSWRL in 1980 have registered a dynasty. Seven of the eight BRL teams had had a dynasty by 1987 with the newest, Redcliffe, being the only exception. Eighteen different clubs has dynasties in the RFL system, including several seasons (58/59, 59/60 and 65/66) where there are four simultaneous dynasties. That might sound excessive, except there are thirty-odd teams in the top flight football at this time, as the second division was only permanently re-introduced after the 1972/73 season.
Initially, one of the things that struck me was the relative deficit of dynasties in Sydney, continuing in to the modern Australian league, when compared to Brisbane and England. The last two decades have only had two clubs in dynasty mode, Sydney and Melbourne. There’s no real equivalent to this anywhere other than Sydney.
Indeed, it seems to be Sydney’s default, especially after World War II. I wonder if this is due to the impact of money – specifically, from poker machines that were not available to Brisbane or English clubs – leading to a more skewed distribution of talent in the league and allowing richer clubs to accumulate talented players in the absence of a proper salary cap.
The NRL-era in Australia tends to undermine that suggestion but financial disparity might also explain the dominance of the big four during the Super League-era in England. While the European league has a salary cap, many clubs do not have the financial firepower to spend up to it, leaving a gap to the richer organisations.
The Brisbane dynasties were less dominant than their southern counterparts, with only Norths’ six-in-a-row run during the 60s hitting the maximum peak of 18, while Sydney had four, suggesting that the margin between top and bottom was less in Brisbane and that if you found yourself behind, it didn’t take much to close the gap. Alternatively, perhaps it was easier to maintain a relatively consistent standard of football with fewer teams to distribute talent around.
To some extent, the argument is arbitrary. Brisbane has more dynasties than Sydney: 16 plays 11 prior to 1980. In Brisbane, the average run is 6.8 years, compared to 7.6 years in Sydney. But combining Wests I and II or Valleys III and IV, where very successful teams are only separated a season or two, changes the figures above. Brisbane would then have longer average dynasties with only three more in total.
There is some evidence that professionalisation and stability of the leagues over time has improved competitiveness. For example, undefeated teams were rare and certainly not a modern phenomenon. To find the most recent in each competition, we have to wind back to Valleys in 1955 (17-0) and St George in 1959 (17-0-1) or further back to South Sydney in 1925 (12-0) for a 1.000 winning percentage. As far as I can tell, it’s never happened in England since the Northern Union formed. The closest were Wigan in 1986/87 and again in 1994/95, finishing both seasons with 28-2. Similarly, teams with no wins are rare. In Brisbane, the last was Wests in 1946 (0-10) and in Sydney, Easts in 1966 (0-18). In England, these depths haven’t been plumbed since Runcorn in 1914/15 (0-26-1), Treherbert in 1909/10 (0-12) and Liverpool City in 1906/07 (0-30).
It would seem that the NRL dynasties that we have had, have been less impactful than in the past, which might speak to the NRL’s relative equality. This is in contrast to the Super League’s big four, with Super League era dynasties occupying four of the top six all time English dynasties. That suggests we might actually be dealing with recency bias, and a third premiership in a row to the Roosters certainly would confirm that.
In Australia, the 90s are a bit of a mess. While Canterbury and Manly were very good teams at the time, I doubt anyone would consider them in the pantheon of all time greats. Both dynasties end up in the bottom third of the all-time total rankings. The Brisbane dynasty has the unusual caveat that the rolling sum goes to zero in 1996 but there’s an achievement that year (one point for a winning record above .700) and you have to roll back to 1991 to find the next year with no achievement and a rolling sum of zero. I think the dynasty running from 1992 to 2000 is correct, even if there was a reload in the middle of it and the dynasty maintains a 3.0 average per season over the six year and nine year iterations. A similar situation exists simultaneously for Canberra and whether it should be extended past 1991 to 1995 and I decided to go the opposite way. If it bothers you, feel free to add 4 seasons to their run and an additional 5 points to the total and/or take 3 seasons off Brisbane’s run and subtract 9 points.
Wigan V, Melbourne II and Sydney Easts IV have the possibility to continue through 2020, and beyond depending on how the teams perform and what shape football takes moving forward.
Fingerprints of the Immortals
Not every dynasty has an Immortal and not every Immortal player has a dynasty. In any case, Immortality isn’t decided solely on club football but this can be an interesting tool for verifying that epitome of talent, as their careers tend to align with dynasties:
- Churchill: Sydney Souths III, before kicking off Brisbane Norths II
- Raper, Gasnier, Langlands, Provan: St George I
- Fulton: Manly I
- Lewis: Valleys V, before moving to Wynnum Manly I
- Messenger: Sydney Easts I
- Brown: Sydney Easts II
- Meninga: Brisbane Souths II, before moving to Canberra I
Not pictured are Beetson, Johns and Burge.
Arthur Beetson is an interesting case that shows the limitations of this idea. He played for a number of clubs and won premierships at Redcliffe in 1965, Balmain in ’69 and Sydney Easts in ’74 and ’75. He also played for runners-up in the ’66 Tigers, the ’72 Roosters and the ’81 Dolphins in the twilight of his career. If he had managed to string that together at one club, he would have absolutely been included in the above list but instead, four premierships for three clubs in eleven years with an exceptional representative career is what gets him the nod.
While you can argue that Immortals should be supremely talented in their own right, irrespective of the team around them, you only have to look at the St George dynasty that had the services of four Immortals to see that selectors have not necessarily bought in to that idea. The Dragons’ dynasty almost certainly could not have been assembled under current salary cap rules and it raises the question of how their careers would be perceived if they weren’t part of the eleven-in-a-row dynasty.
Out of the potentials in the NRL era, Inglis, Cronk, Smith and Slater would be the obvious candidates once inevitably inducted into the Hall of Fame. They formed the core of Melbourne’s first asterisked dynasty and three of the four played through the second. Cronk even played across three, moving from two of Melbourne’s to Sydney’s current before retiring. Lockyer, Webcke, Tallis, Civoniceva and Langer are all current Hall of Famers who played in Brisbane’s dynasty years. Brad Fittler would be easily the best prospect out of Sydney’s two.
Not knowing much about the English game, it’s hard to identify what their equivalents might be. The most obvious example was Martin Offiah. He started his career at Widnes during their second dynasty and then moved to Wigan for the peak of their all-conquering fifth dynasty. Ellery Hanley also played the peak Wigan V years. At the other end of the timescale, Harold Wagstaff turns up in Huddersfield I.
