The overwhelming majority of fans get their NRL fix through the TV. An average round will attract 124,000 in the stands but 3.6 million, thirty times as many, will tune in via subscription (PTV) or free-to-air (FTA) television.
TV ratings are an under-explored and critically important part of the modern game. Ratings should be a, if not the, key factor in judging how clubs are performing and what they bring to the commercial viability of the game. Due to the difficulty and expense of getting ratings data, all we really know is that the Broncos are the game’s biggest drawcard. Everything else is a mystery.
That’s no longer the case. A big thank you goes out to @footyindustryAU of the website Sports Industry, who kindly furnished me with all of the ratings data he has collected by hand over the last three years. He’s worth a follow if you want to know what the other Australian codes are up to without having to actually follow anyone associated with the other codes.
The following is based only on regular season games from 2017 to 2019 and we are missing data for the last two rounds of 2017. We have no streaming numbers, so its timely to do this analysis now before that becomes a really significant, and completely opaque, component of how fans engage with the sport.
Let’s start with the obvious:
The basic breakdown of the broadcast deal is that everyone gets equal air time on PTV/Foxtel, with all games broadcast live, but there’s a noticeably inequitable approach taken for the games shown on FTA/Nine. Nine’s goal, having only three of the eight games a week, is to get the biggest teams on screen as frequently as the integrity of the competition will allow.
The highest rated FTA game in the dataset was the round 3 Friday night blockbuster between the Storm and Broncos in 2017, at 904,000 viewers. The lowest was last season’s round 25 Saturday spoon bowl between the Titans and Dragons, at a meagre 273,000. We see a similar range in PTV games, with the best being Thurston’s farewell game against the Titans in 2018, attracting 400,000 viewers on a Saturday evening. A round 19 fixture between the Knights and Titans in the same year plumbed PTV’s lows at only 132,000.
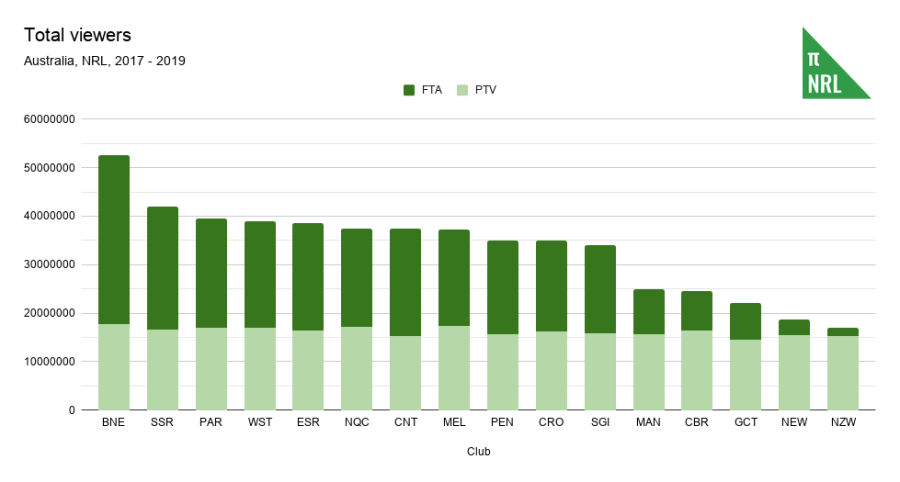
The most watched regular season game in the last three years was the 2017 Queensland Derby in round 2, with 1.2 million viewers (879k on FTA and 303k on PTV) tuning in. The aforementioned 2019 spoon bowl managed just 410,000 viewers in total (273k on FTA and 137k on PTV) in what is possibly one of the least watched simulcast games in the modern era of rugby league. That should provide some context for how much demand there is for a wooden spoon playoff.
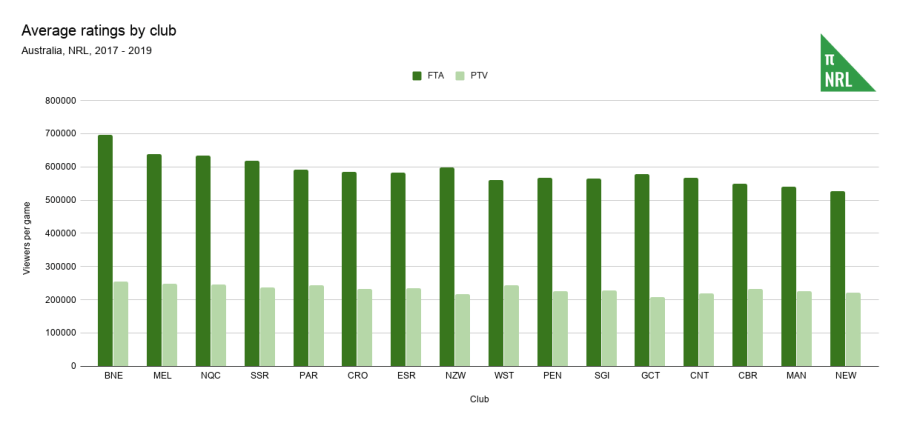
That looks pretty straightforward. The Broncos are clearly the most watched team in the NRL. It might surprise people see who follows them: Melbourne, North Queensland and South Sydney. Most of the Sydney clubs sit mid-pack with the Raiders, Sea Eagles, Knights and Titans rounding out the bottom of the table.
There’s a 20% variation between the top club on PTV, Brisbane’s Broncos against the bottom-ranked Titans, but a 25% gap on FTA between the Broncos and the Knights.
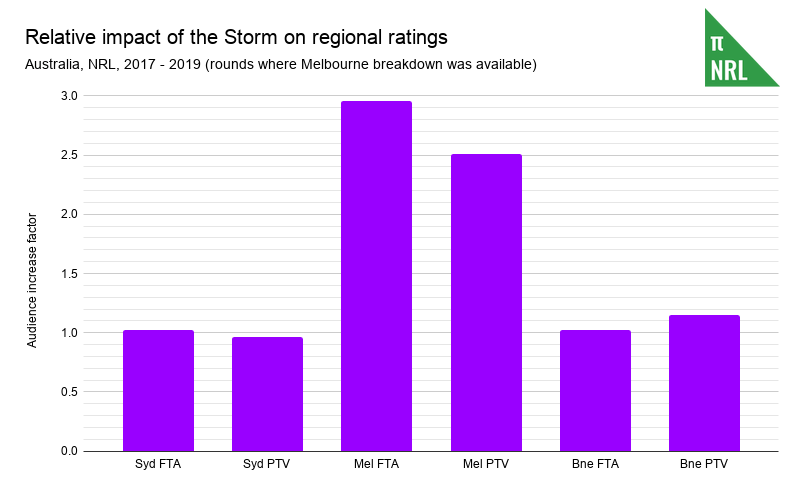
That the Storm are a top rating team in the centre of the AFL universe is an eye-opener to the way the game has changed in the last twenty years and it’s worth a closer look.

A Storm game doesn’t have a huge impact on ratings in Sydney but does add 25,000 FTA viewers and 17,000 PTV viewers from Victoria and another 10,000 viewers in Brisbane (4k FTA, 6.5k PTV). It’s likely that this impact is understated, given how rarely the NRL rates at all in Melbourne. While these numbers sound small in the grand scheme, assuming that those figures generally hold across all games, the Storm would go from having the second highest average on PTV to twelfth, and from second to fourth on FTA without their local audience.
This really puts paid to the idea that teams from Sydney and Brisbane can have any meaningful appeal in the southern states without expansion. To truly engage Perth, Adelaide and other places in any form will require teams in those cities. It is simply not enough for Sydney clubs to move the occasional lack lustre game and hope that simple repetition engages with a wider non-traditional market. If those places are to care even a little bit, they need their own teams.
In Brisbane, a small rise in FTA and a 15% jump in PTV ratings strongly suggests that the Storm are serving as a surrogate fourth Queensland team thanks to the well-documented exploits of the future Immortals that played in purple and in maroon.
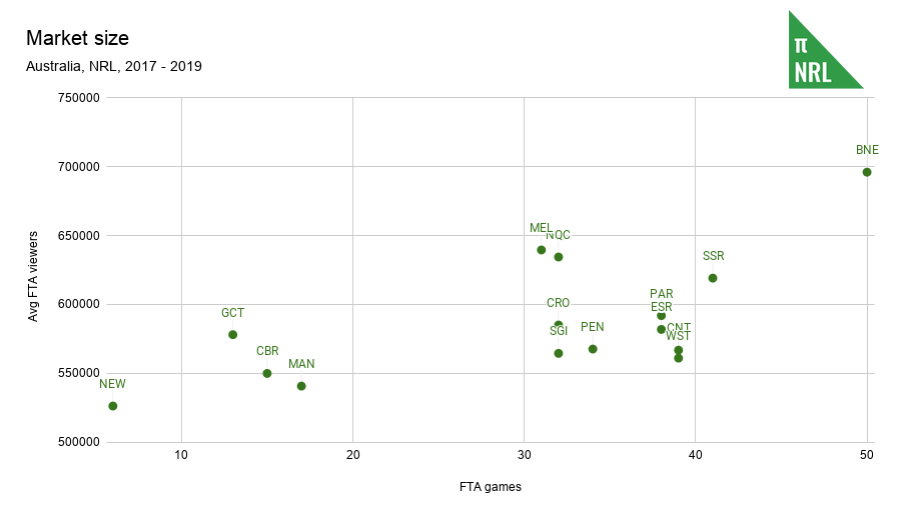
I think this is really interesting because it tells me what Nine think about the relative broadcast appeal of each team. Brisbane is the only true “big market” team, if I’m to borrow the American parlance, which is why they get the most games. Most of the Sydney teams plus North Queensland and Melbourne are mid-sized market teams and even then, there’s a small split between Souths, Parra, Easts, Canterbury and Wests on one side and Penrith, St George Illawarra, Cronulla, Melbourne and North Queensland on the other, for FTA appearances.
The Gold Coast, Canberra, Manly and Newcastle are small market teams, although the Titans appear to out-rate a number of mid-market teams, despite being terrible. There’s no shame in being a small market, unless you’re Manly. Not all markets are created equal and some have value beyond raw commercial appeal.
I’ve declined to include the Warriors because they bring most of their value through the New Zealand TV deal and have had three (3) free-to-air games on Australian TV in three (3) years.
You might want to argue that Brisbane has the highest ratings because it gets the best timeslots or that the Roosters are good, so their ratings don’t reflect the numbers they would get during leaner times. I think you’re right, so I’m going to try to separate out the following variables:
- Timeslot
- Round
- Quality of teams
- Disparity of teams’ quality
To get an apples-for-apples comparison of which NRL team rates the best on TV. Spoiler alert: it’s still the Broncos.
Timeslot
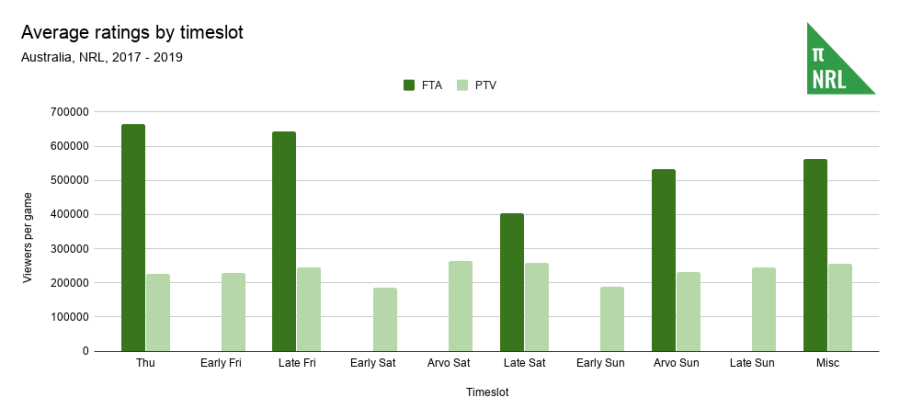
The timeslots are self-explanatory with the “miscellaneous” category sweeping up the odd public holiday games, like the Monday’s Labour Day Bulldogs games or Anzac Day clashes.
The popularity of the timeslots generally aligns with what you’d expect. Saturday is really important to Foxtel, while getting the big teams on Thursday and Friday nights is critical for Nine.
The late Sunday slot, with 6.30pm kickoffs in the early part of the year, is a ratings winner for pay TV. I’m surprised that Foxtel hasn’t proposed a permanent shift from the 2pm kickoff to 6.30pm, even if it would look like the league is being played behind closed doors.
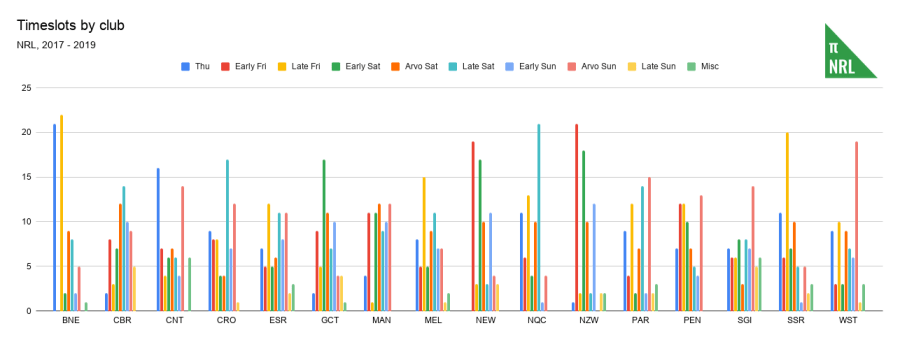
Each club’s arrangement of timeslots is almost like a fingerprint. The Cowboys dominate the late Saturday slot, the Warriors the early Friday game and Sydney clubs the Sunday afternoon game, just as much as the Broncos have the Thursday and Friday games. You can tell a team is being buried by broadcasters by how many early games they have.
The data I have does not go back far enough but I would have been curious to see how Thursday night ratings stack up against Monday night football. Reportedly, people prefer Thursdays to Mondays but I don’t have evidence for that.
Round
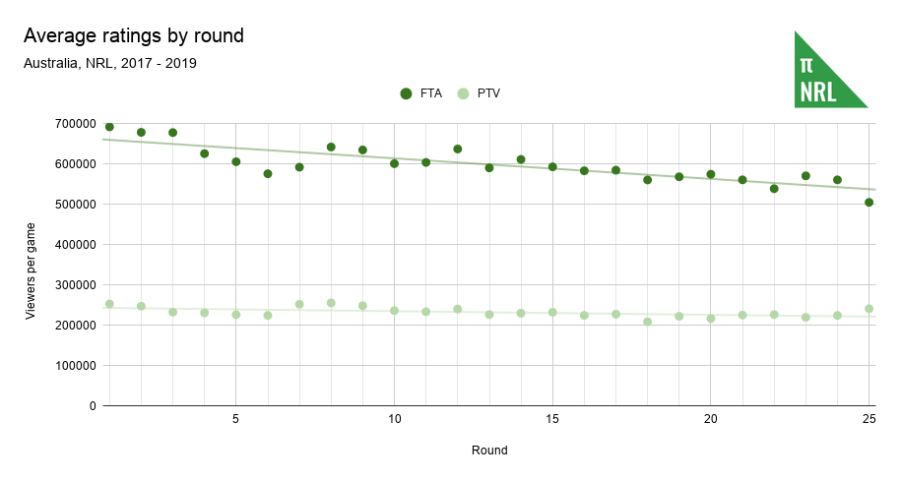
Generally speaking, PTV loses about 900 viewers per game for each round the season progresses and FTA loses closer to 5,000. That’s about 0.3% and 0.8% of the average audience respectively. In other words, about 20% of the audience that was watching Nine at round 1 has tuned out by round 25 (this only about 8% on Foxtel).
This is presumably a by-product for all closed leagues around the world. Fan engagement dwindles as fewer teams have anything meaningful to play for. If you want to know why there’s a push for wild card games in the NRL or expanded play-offs in other sports, there’s your answer.
Do open leagues, with promotion and relegation, avoid this tail-off towards the end of the season? Does gaining these viewers back offset the risk that you might lose a commercially important team to relegation? Conversely, do first-past-the-post leagues lose viewers as teams fall out of the race for the title but are safe from relegation and so have nothing to play for?
We see bumps after the first third of the season as public holiday games during Easter, Anzac Day and Labour Day give the ratings a nudge upwards.
Quality of teams
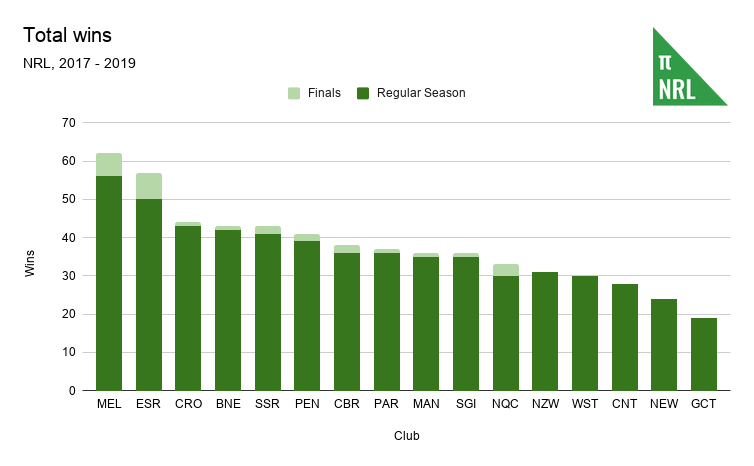
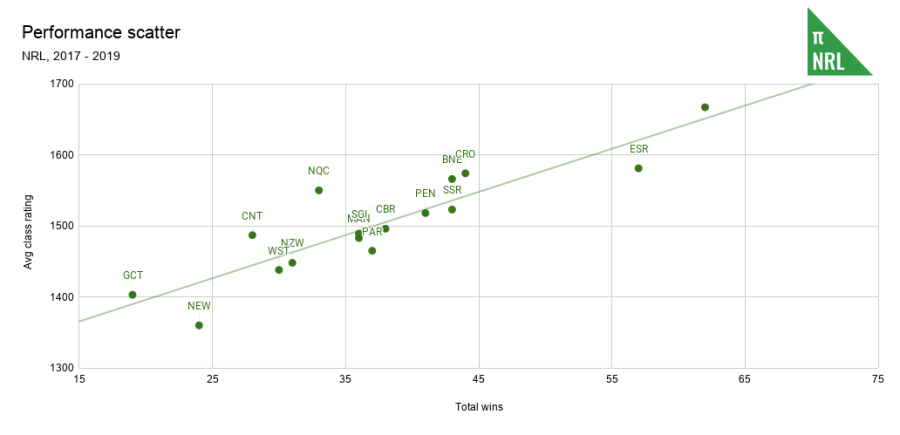
If you’ve made it this far without knowing what Elo ratings are and how they reflect performance, you can either read up on it or look at the above two graphs. There’s a 0.8 coefficient of correlation between the average class Elo rating over 2017 to 2019 and the number of wins that team has. The 20% not explained by the ratings is attributed to the different starting points teams had at the end of the 2016 season, among other noisy and inconsequential factors.
It’s important that you understand this because I’m going to use Elo ratings as a proxy for team quality. There are two types of Elo ratings on this site: form (short term performance) and class (long term performance).
The reason I make this distinction is because if the Roosters, for example, go on a six game losing streak, their form rating would be destroyed but their class rating would reflect a smaller loss. This is by design as we don’t yet know if this is a collapse of the Bondi empire or a blip on the radar caused by Origin selections. If losses continued, the form rating would bottom out to a point where it reflects our expectations that the Roosters will lose and the class rating would catch up eventually, reflecting the overall sentiment about the prospects of the club.

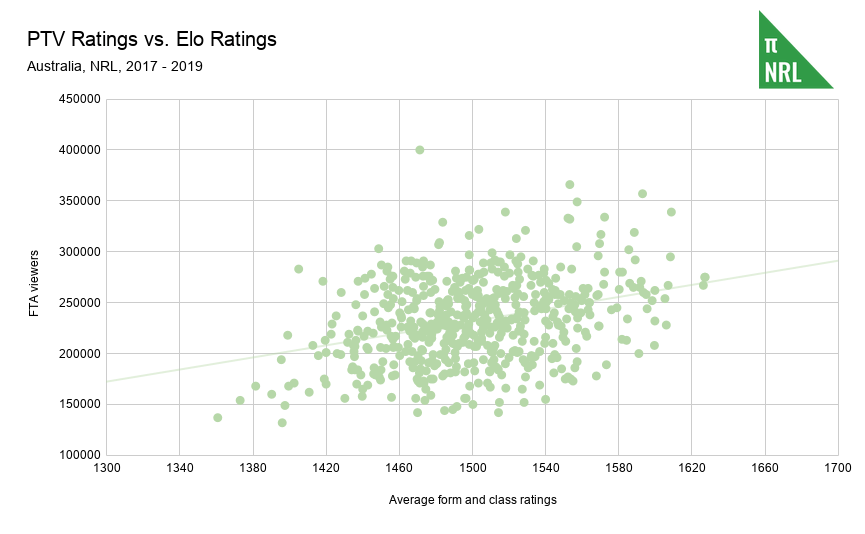
My expectation is that games featuring better teams will rate better. Neutral fans might be more inclined to watch a top of the table battle than a dust-up between two sets of incompetents. I’ve used the average of the competing team’s class and form Elo ratings to identify which games have “good” teams and which ones have “bad” teams.
While the relationship certainly exists, it is a relatively weak one unless you put the games in buckets. I used buckets of 20 rating points and the coefficient of correlation is 0.90 on PTV and 0.58 on FTA. This adds some evidence to the argument that Foxtel’s audience is relatively more interested in the potential quality of the match than Nine’s.
Disparity in team’s quality
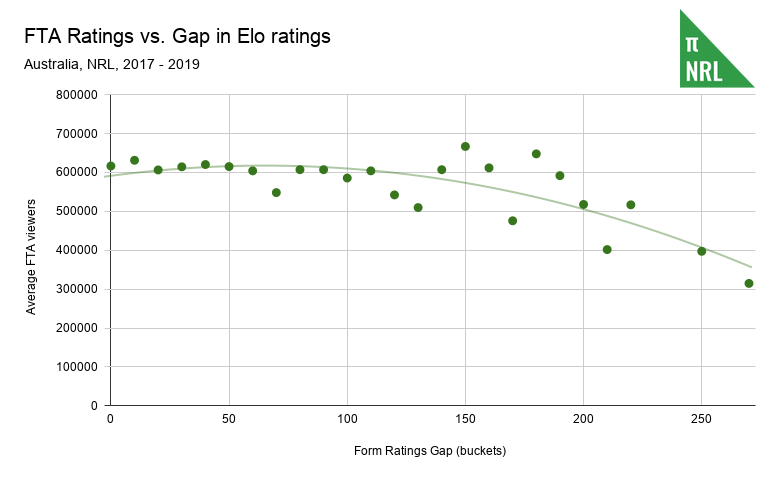
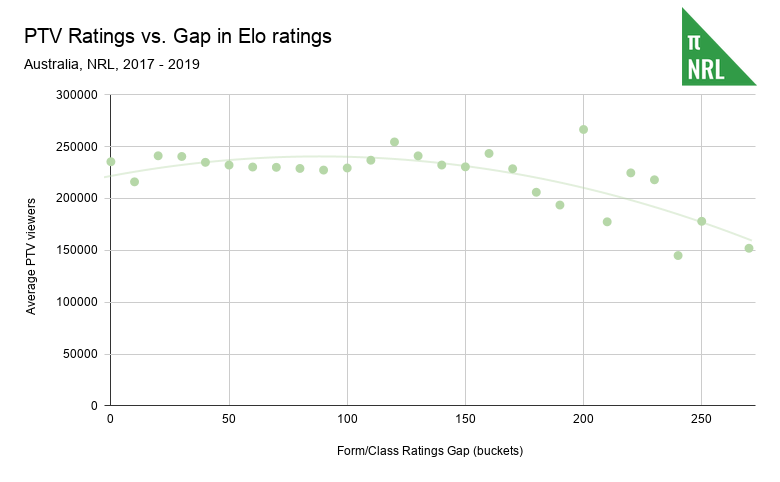
The problem with just using the average of Elo ratings is that a game between two teams rated at 1500 has the same rating as a game between a team rated 1350 and another at 1650. These two scenarios have completely different prospects for entertainment value. To account for that, I plotted the gap between the two teams to reflect the expectation that the game will be close or a hiding.
This is a rare example of a non-linear relationship. On the horizontal axis, we have the difference between the two teams in Elo rating terms to serve as a proxy for the likelihood of the game being a blowout as the greater the gap, the more lopsided the encounter is expected to be. What we see is that viewers are not likely to modify their behaviour until the win probability for the favourites starts to exceed 70% or so (lower than approximately $1.40 in gambling terms), after which people fail to tune in. The sample size decreases as the curve moves to the right, so is subject to more noise but the coefficient of correlation is still 0.65.
A strange quirk for this analysis is that I used the average of class and form ratings to analyse the pay TV numbers but only form ratings for free-to-air. I did this because it works better (higher coefficient of correlation) but also further hints that FTA and PTV viewers do not use the same decision making framework.
Stripping out the variables
The purpose of these graphs is to determine a relationship between the variables we want to remove and the ratings data, so that we can go back and account for those variables in explaining the ratings. The relationships do not explain 100% of the observed phenomena but if we do a good enough job of accounting for the variables, most of what’s left is the raw pulling power of the club in question.
For each variable, the trendlines established above are converted to a percentage of the average FTA or PTV rating. These four percentages are averaged and deducted from the percentage over or under average for the game’s rating. The residual percentage is averaged for each club over the three regular seasons as an indicator of the club’s attractiveness to viewers.
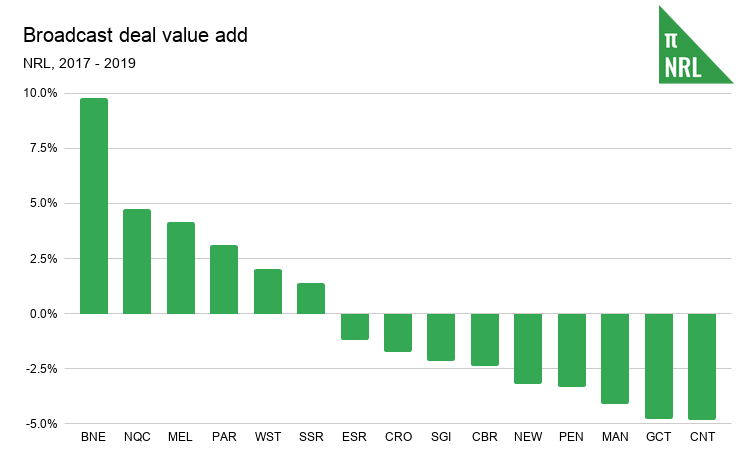
I’ve called this “value-add” because that’s what it is: it’s what each club adds to the ratings compared to the league average, all others things being equal.
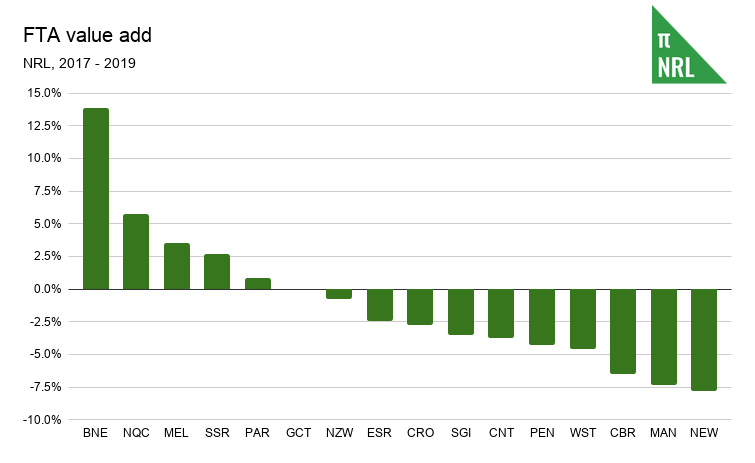
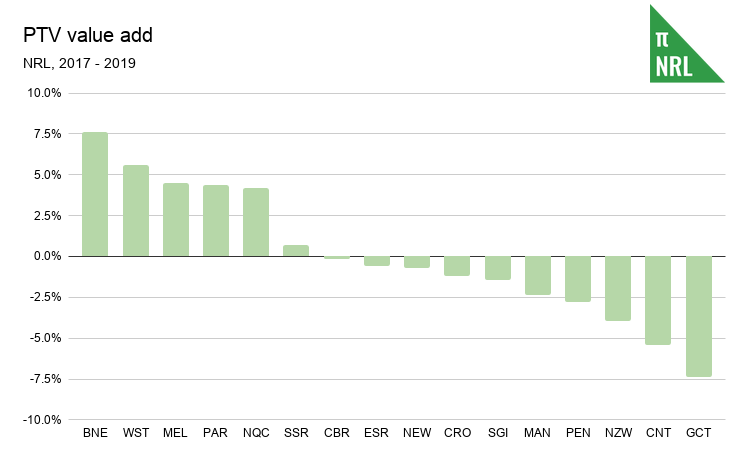
Based on the best I could find, Foxtel contributes about 65% to the current Australian broadcast deal, while Nine picks up 35%. Weighting the FTA and PTV value-adds accordingly, give us the below:
As always, I have caveats.
Because this is real life involving people and not the physics of subatomic particles, there’s going to be variation, noise and errors that make it problematic to rely on the results of this analysis as an indisputable truth. This is why I’ve chosen not to weight the different variables being stripped out as more important than the other, as doing so would likely introduce more error, not reduce it.
In reality, the variables all feed on each other and there’s no clear order of cause and effect. The Broncos are a big market team that has generally been successful, in part because of the advantages of being a big market team, which leads to bigger ratings and more frequent appearances on TV, reinforcing their status as a big market team. While we would normally overcome this with the battering ram of sheer sample size, we do not have that luxury and so work with what we have.
I briefly toyed with the idea of trying to account for the opposition on a match-by-match basis but the levels of recursion made me go cross-eyed. If that invalidates my approach for you, so be it. I think the reality is that most of these variables more or less cancel out over time.
TV ratings are inherently problematic. They use a small sample size of people to determine what the rest of the nation is doing. Oztam is not a particularly transparent organisation and the fees to get access to their data are on the order of $20,000. Further, there’s no accounting for streaming numbers. That said, we don’t have much else to work with at this scale.
The concept of value-add represents the idea that a game featuring the Broncos would probably rate 10% higher if they replaced an average team in the league, all other factors being equal. What that means in dollars is not clear. Or, in other terms, how many people will watch a NRL game, purely because it is a NRL game?
A back-of-the-envelope estimate suggests that each club brings about $12 to $21 million in base value to the broadcast deal (under the 2019 terms of the agreement). The Broncos’ value-add is somewhere between $6 and $26 million over and above that base value. If you’ve noticed that looks like a big range, that’s why I’m not confident publishing the estimates for other clubs and that’s without trying to estimate how much of the broadcast deal is Origin and finals, rather than the regular season.
I think the free-to-air ratings do a better job of measuring widespread appeal, while the pay TV ratings better show what the hardcore fans want to watch. The audience on Foxtel is much stickier, which suggests to me that there is a larger component of the audience that will watch anything rugby league, preferably good quality rugby league, whereas Nine’s audience is driven by the teams involved and how they happen to be travelling at that point in the season.
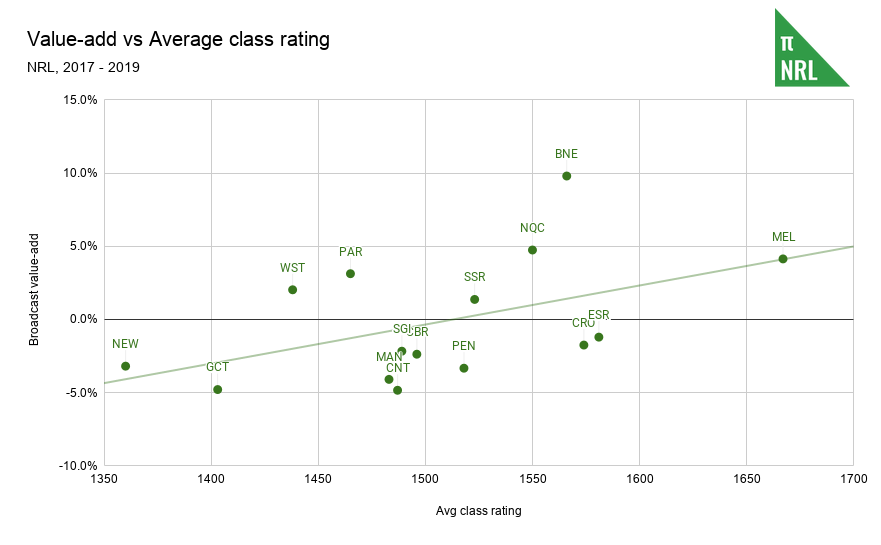
I don’t think I’ve fully stripped out the performance of the teams and their impact on ratings. There’s a 0.25 coefficient of correlation between the average class rating over this time against the broadcast value-add.
This brings us to the end of the analysis and to the commencement of speculation, specifically in terms of ceilings and floors. The trendline would suggest teams above it return a greater value-add given the performance of the club than the league average club would with the same performance. The reverse applies to teams below the line.
If the Tigers get better, we would expect them to slide to the right and up, as the improvements in team quality lead to an improved value-add, and I would expect them to keep roughly the same buffer to the trendline.
For the opposite case, the Roosters won two of the three premierships under consideration, so their value-add (seventh best in the league) is probably as high as its going to be. A return to the pre-Politis days would beg the question how many people would be compelled to watch Eastern Suburbs scrap it out for mid-to-lower table honours. If the commercial premise of the club is based on it being good in perpetuity, then that is not a sustainable strategy. I have the same question, but with a much more immediate emphasis, for the Sharks.
The Knights had a torrid time over the back end of the 2010s but still appear to bring more to the table than we might expect from other clubs in the same position. As Newcastle continues to pull itself out of the abyss, I wonder if they might start bringing a positive value-add over average, which would be remarkable for a city with a metro population of only half a million. You would expect them to drag on the league, being a small market whose primary purpose is to represent, rather than deliver a commercial return.
As for the Titans, the NRL’s youngest club and with no real success to speak of to date, the Gold Coast have not had much on which to build a fanbase. Modern expansion teams (post-1980) have at least two things in common: grand final wins and future Immortals. The exceptions are the Warriors, whose New Zealand TV deal secures their place in the NRL forever, and the Titans, who have never had prolonged star power or on-field success. All the other expansion clubs are gone.
The Titans might not have much appeal to the purist Foxtel audience (or worse, NRL Twitter), the Gold Coast’s FTA value-add is nonetheless the sixth best in the league. While there’s a small sample size and most of those games have traditionally been against higher rating teams, that’s also somewhat offset by the lowest rated game in the dataset. That suggests plenty of commercial power waiting to be unlocked by the next Lewis, Meninga, Johns, Smith or Thurston if they make it to Robina and bring the Provan-Summons to the Gold Coast. As I’m fond of reminding people, if the NRL can’t get a club off the ground in Australia’s sixth largest city in rugby league heartland, then there isn’t much hope.
The million-dollar question, especially in the context of the supposedly imminent collapse of every NRL club and one Immortal suggesting that four teams should be pushed over a cliff, is how each of the Sydney clubs stack up. Based on this analysis, you’d keep the Rabbitohs, the Eels and the Tigers. For the rest, who knows? Can the Bulldogs bounce back from their recent lows to re-engage with their presumably larger and recently absent fanbase? Manly have been bang-on average over the last three years and still put up regional club numbers. Put them in Newcastle’s position circa 2016 and it’s unlikely that the NRL would see much point in trying to prop them up.
The reality is that each club’s destiny is in their own hands. Souths have gone from being so insignificant that the league was prepared to do without them and now are making a case to be Sydney’s most popular team. That takes time and money and marketing but it’s not a skillset unique to the Rabbitohs and their owners and managers. Anyone can do it if they have the will and resources and if your club doesn’t have the will or the resources to expand the fanbase, then what is the point?
If the NRL did cut teams, we may well lose their existing fanbases to the void, but a new Perth or Adelaide or New Zealand or even a second Brisbane team might bring more people in to the fold to replace them and then some, resulting in a net benefit to the league. A second New Zealand team should add enough to the kiwi TV deal to pay for its own club grant and if nothing else, it would eliminate the need for 6pm kickoffs on Fridays in Australia. Perth and Adelaide might be able to justify the addition of a third Friday night game or bring online the late Sunday timeslot, as well as engaging their local markets better than outside teams could ever hope to. Even the addition of a few tens of thousands of viewers would be valuable. If a new Brisbane team brought in half as much value-add as the Broncos, they’d still be ahead of the rest of the NRL.
An addendum about regional FTA figures
A couple of people asked about regional viewing figures compared to metro. All of the above FTA analysis includes the regional numbers. I won’t be breaking further down by region because that information is not consistently available across the dataset and so the numbers it throws up might not be as reliable.
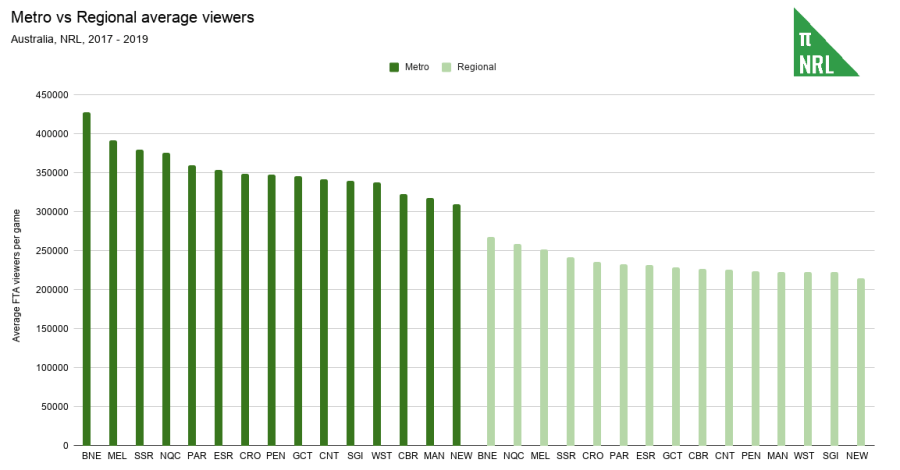
The audience for the average FTA is 40% regional (236k) versus 60% metro (361k). Unlike AFL, where I believe this proportion is skewed more in favour of metro areas, it’s important to get the regional numbers when assessing the performance of NRL ratings.
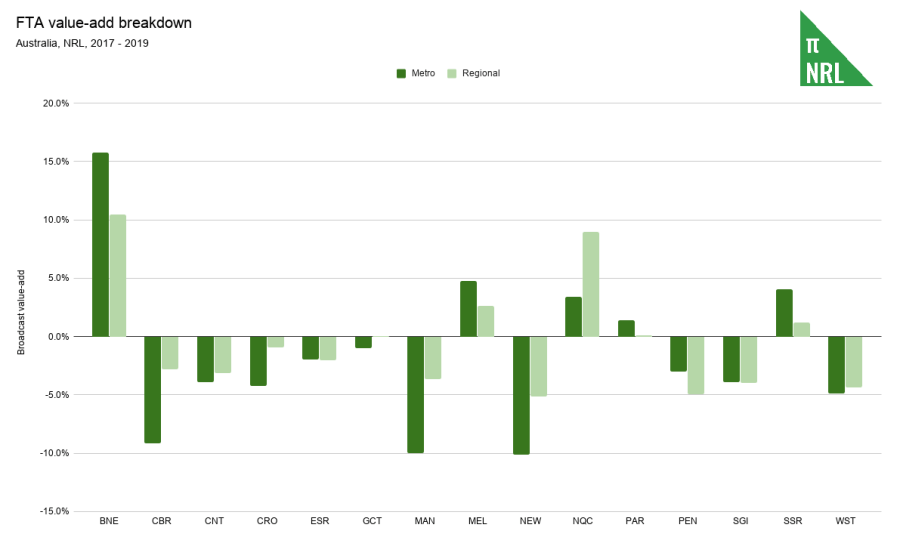
The popular teams are still popular, whether the market be regional or metro. The gap between the top and bottom clubs (Brisbane and Newcastle, respectively) is 28% and 20% for metro and regional respectively. The regional clubs – Canberra, Gold Coast, North Queensland and Newcastle – have significantly more value-add, once all the variables are stripped out, in regional ratings than metro. The Cowboys are 4th by average viewers in metro markets and 2nd in regionals, the Titans move from 9th to 8th, the Raiders from 13th to 9th and the Knights are at the bottom of both, but halve their metro value-add of -10% to -5% in regionals.
Worth remembering that given the lesser variation in regional numbers than metro, the tendency for all clubs will be to revert to mean value-add (0%) from metro to regional.