

Can we predict a premiership winner from their Elo ratings?
Obviously, yes. That’s what the Stocky is for and this site would pointless if this was not true. But what if we wanted to look into the future before a single game has been played? I think that the Elo ratings of premiership winning teams might have a common pattern to them that show up if we take a closer look at their long term performance, or class, ratings with Eratosthenes.
We’ll need some premiership winners to review. To do this analysis I’ve tried to pick one premiership per club (to avoid autocorrelation) and pick a premiership that stands on its own. That eliminated a number of premierships years for Melbourne and multiple premierships for Manly and Brisbane. I also biased it towards more recent premiers where possible. I was left with the following list:
- 2001 Newcastle Knights
- 2003 Penrith Panthers
- 2004 Canterbury Bulldogs
- 2005 Wests Tigers
- 2006 Brisbane Broncos
- 2010 St George Illawarra Dragons
- 2011 Manly Sea Eagles
- 2012 Melbourne Storm
- 2013 Sydney Roosters
- 2014 South Sydney Rabbitohs
- 2015 North Queensland Cowboys
- 2016 Cronulla Sharks
That’s a good line-up but for many sides, it was one and done – see Knights, Panthers, Tigers, Bunnies, Cowboys (for now) and Sharks. Multiple titles this century have been the domain of the Storm, Roosters and Sea Eagles only.
Anatomy of a premiership winner
Below you’ll find the plot for each of the premiers class ratings for the two seasons before the premiership and the three after. Each group of 30 games represents approximately one season of play. The premiership season is games 60 through 90.

That looks a bit messy, so we’ll clean it up by showing the average team, along with the extremes, which is basically the Storm with a bit of Manly at the top and the Tigers at the bottom. I’ll also show the standard deviation (σ) – plus one and minus one – around the mean. The standard deviation is a good measure of spread, the higher the deviation, the more the values are spread out. For our purposes, it’s worth knowing that approximately 63% of teams will fall into this band.
The basic pattern we see is that what happened a couple of seasons ago is not really relevant. Most sides are pretty average, tending to be above average, through games 1 to 30.

The season before sees a run up in class. Generally, next year’s premier was a contender, but not necessarily a winner, the year before. Think the 2000 Knights (3rd), 2013 Rabbitohs (2nd) and the 2009 Dragons (1st). Teams like the 2002 Panthers (12th) and 2004 Tigers (9th) going on to win premierships the next season are more rare but obviously not impossible.
The premiership season sees a massive improvement in class as the premier wins a stack of games (generally, enough to finish at least top four) before powering through the finals, maxing out at around game 90.
After that the premiers regress in the direction of mean (1500 rating). Interestingly, while a premiership winning side can come from almost anywhere on the spectrum of class ratings, once the side has won the premiership, the team generally drifts down from an average peak at 1600 to around 1550 at a pace much slower than their initial rise.
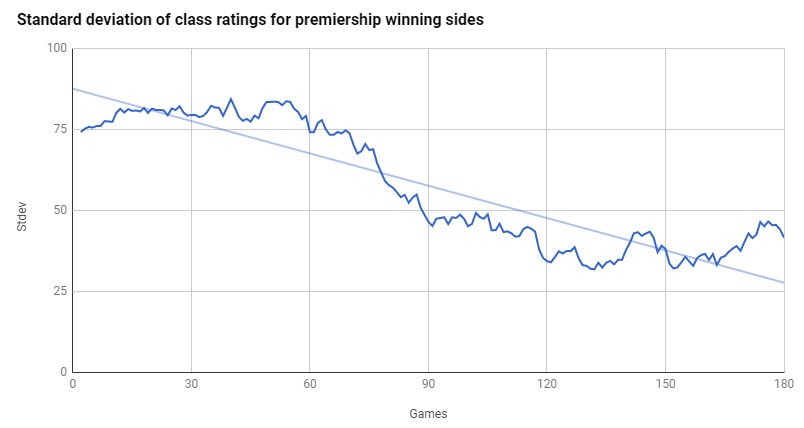
The above graph shows the spread of winners’ ratings across the data set: the greater the standard deviation, the greater the spread. We see that the pre-preimers are a much more eclectic group than the post-premiers. The standard deviation halves from 75 (as in two-thirds of teams are within 75 rating points of the mean) to around 35. The standard deviation picks up again in the last season as the “premiership aura” wears off and teams return to their long term structural competence (e.g. Storm and Sea Eagles have generally been better than Panthers and Tigers).
2018
None of that is terribly surprising. Premiership winning sides win more games than not and are usually good the year before. The obvious question is who fits that pattern this year?
Let’s look at it team by team:
 Brisbane Broncos

The Broncos actually fit the mould pretty well. Last year was better than 2016 and while they’re a bit higher than the mean, Brisbane sits in the typical band. Their other choices as club, particularly the recent trend of signing (allegedly) violent criminals, is less appealing.
 Canberra Raiders

I know everyone was disappointed with the Raiders’ effort in 2017 after such a massive performance in 2016 but if you look at the graph, the most important thing is that they didn’t go backwards. The same major pieces are in place from 2016 to see the Raiders take the next big leg up. I’m seeing potential here.
 Canterbury Bulldogs

Bulldogs done gone backwards last year, which is not a good sign. I don’t think we’ll need to consider them further. The trend for winners is upwards.
 Cronulla Sharks
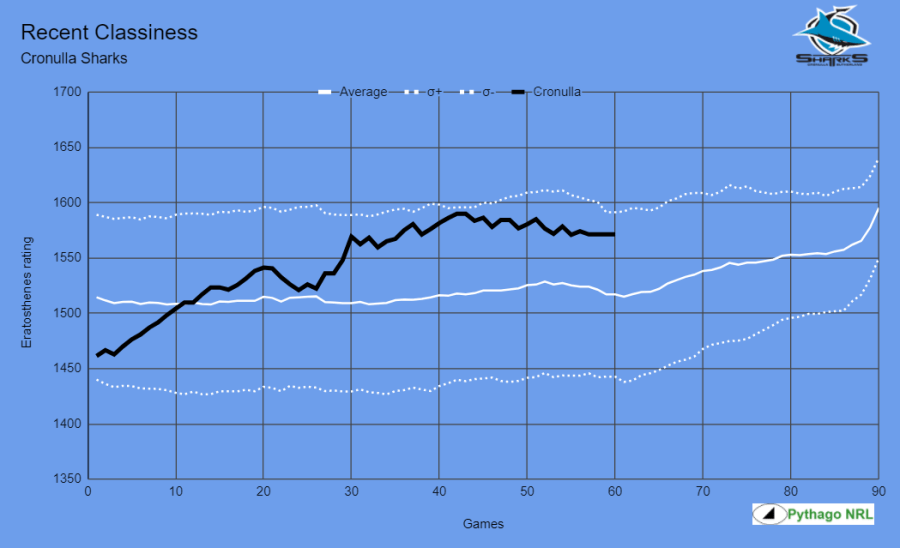
The Sharks are a slightly unusual case in that games zero to thirty on this chart are a premiership winning season. They’re still enjoying the premiership aura but last year’s performance coupled with some of their roster changes don’t give me a great deal of confidence that there will be another leg-up this year.
 Gold Coast Titans
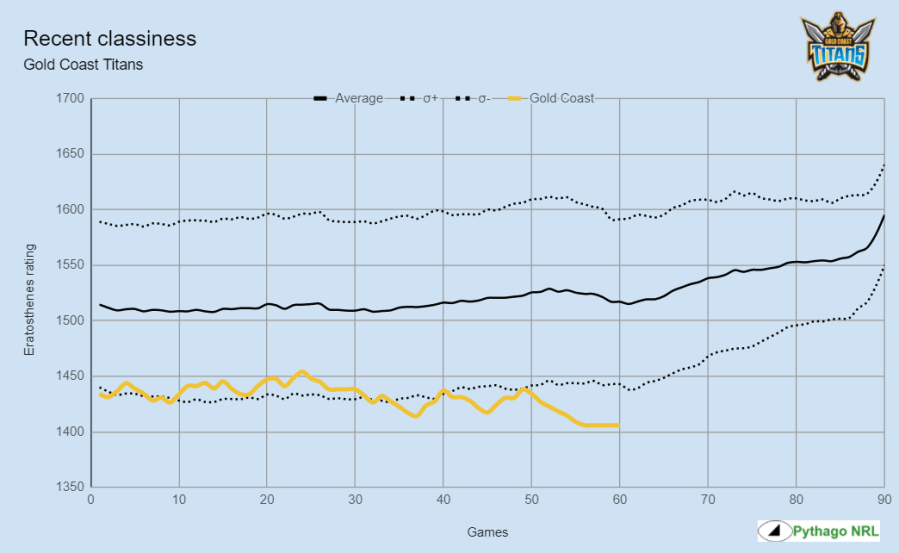
I feel reasonably confident in asserting that the Titans are not capable of a Leicester City, or even a 2005 Tigers, so let’s just move on.
 Manly Sea Eagles

When I started putting this together mid-last year, I figured Manly would be a contender. Yeah, nah.
 Melbourne Storm

What’s left to say? If they have another blinder of a year, Melbourne will literally be off the chart. With the talent they have, they will always be contenders but I would expect more reversion to mean in 2018.
 Newcastle Knights
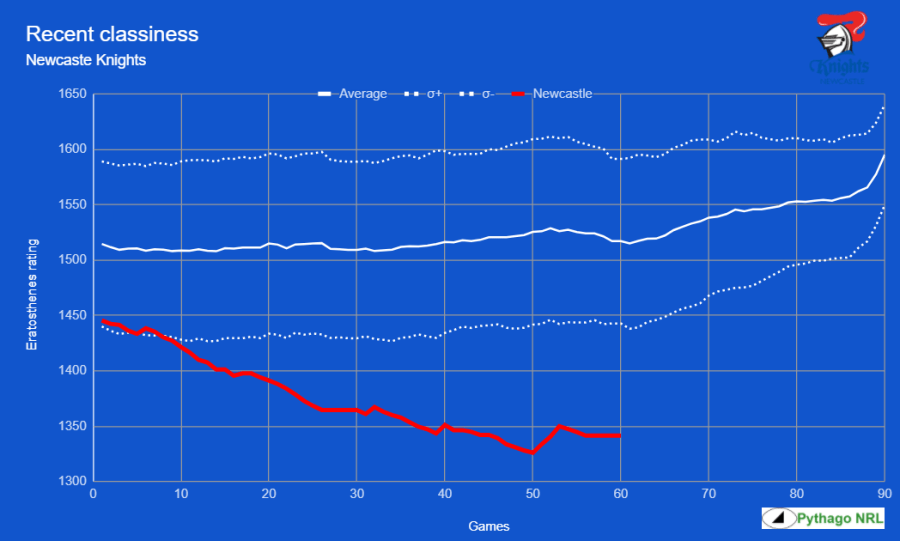
The Knights have a few years of re-building ahead before we need to worry about them.
 New Zealand Warriors

The Warriors seem intent on staying mediocre. Good for them.
 North Queensland Cowboys

The Cowboys have just come off their 2015 premiership high, they lost a test quality prop and one of the greatest players of all time last season and still made the grand final. We will look past the technical going backwards to continue to rate North Queensland a premiership threat in 2018. Even though it doesn’t fit our pattern, like Melbourne, any other conclusion would be idiocy.
 Parramatta Eels

Well, that’s what we want to see. Not me personally of course because I don’t like the Eels but the trend is there. It’s up. When combined with a young, talented halves pairing that are improving with every game, the fact that Parramatta are a bit below average doesn’t matter. They should be in the hunt in 2018.
 Penrith Panthers

Nathan Cleary and James Maloney may as well get their fingers measured up for that premiership ring they’ll be wearing come October. The team definitely has potential.
 South Sydney Rabbitohs

Maybe next year, Bunnies fans, maybe next year. It’s only been a few years since your last premiership. The one before it was forty-three years, so there’s still could be a way to go.
 St George Illawarra Dragons
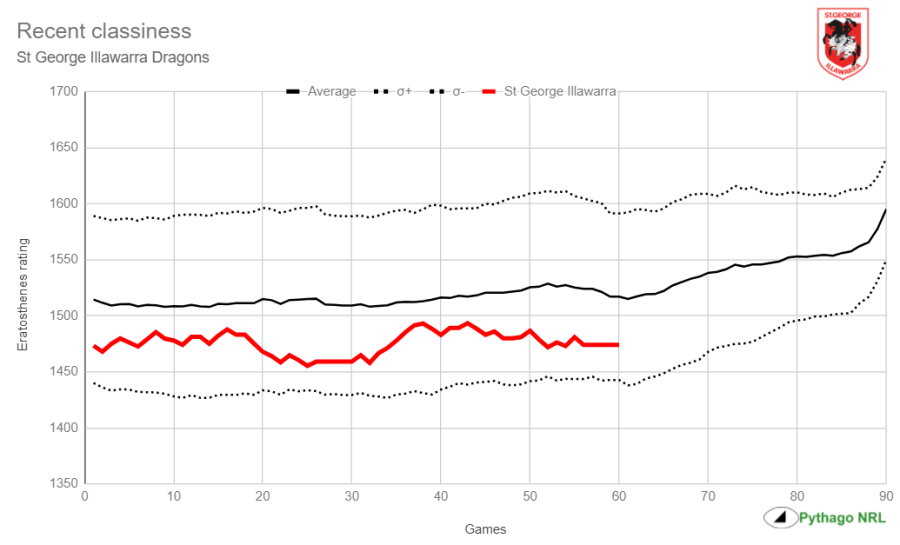
Despite looking hot for about fifteen minutes last year, I can’t in all good conscience look at this graph and give Dragons fans any hope. Sorry.
 Sydney Roosters

With about $15 million in talent playing for $9.5 million, I think the Roosters will be OK, irrespective of coming down a lot in 2016 and then trying to rebuild in 2017.
 Wests Tigers

I guess the only hope is that the Tigers came from nowhere in 2005, so anything’s possible? Maybe Benji will get about fifteen years younger somehow. Falling more than a standard deviation away from the average is not ideal.
But don’t get me wrong. This is about as robust an analysis as technical chart trading or, if you prefer, reading tea leaves. It reflects my biases as much as objective pattern spotting. I’m sure there’s a mathematical technique for assessing this but the ones I tried didn’t agree with my conclusions (and varied quite a lot).
The bigger, actual problem is that we ignore how many teams fit this pattern for games zero through sixty and then fall away before they win the premiership. The 2009-11 Titans are probably the best example of this, with back-to-back top fours in 2009 and 2010 and then a wooden spoon in 2011. They have yet to get back to anything like that peak since.
Nonetheless, I feel life is looking downright positive for fans of the Raiders, Eels and Panthers and, as always, the Cowboys, Roosters, Storm and Broncos will be there, if not thereabouts.
