

This headline (the actual article is fine) from Tim Gore typified the attitude when the draw was released in November last year:
Not only were the NRL never going to redo the draw, it speaks to the tendency that the they can do no right in the fans’ eyes (“Release the draw earlier! No, not that one, a different one”).
Looking at last year’s ladder and having a whinge that your team has to play three top four teams twice is peak gronkery. It’s fuelled by emotion and we can do better. So here you go: a quantitative analysis of who has the toughest draw in the NRL.
2018 schedule
A bit of housekeeping before we dive into this:
- The initial rating is the team’s current (pre-season) Eratosthenes rating. It’s a measure of long term performance – the higher, the better, with a league average of 1500 – and basically tells us whether we expect a team to generally be good or not (Melbourne at 1650 is good, Newcastle at 1341 is not). I’ve divided the teams into five groups to make it a bit easier to parse: over 1600 is A, 1550 to 1600 is B, 1450 to 1550 is C, 1400 to 1450 is D and under 1400 is E.
- The average opposition rating is just that. It’s the average of the team’s opposition across the season. In this case, we would expect teams that have to face higher rated (good) teams twice to have a higher average than teams that get to slack it by playing more bad teams twice.
- I am not explaining what a rank is.
- The degree of difficulty compares the initial rating to the average opposition rating. A class A team rated 1600 isn’t going to struggle to deal with an average opposition rated 1510, while a class D team rated 1440 will find this an uphill battle. It’s a relative comparison.
I’m not considering travel or the time between games, which Tim Gore did a pretty good job of, or the impact of rep games which typically takes the highest toll on the three good Queensland teams more than anyone else (I’m old enough to remember when the burden just fell on the Broncos). These factors could be important but I only want to look at the difficulty of the opposition that the draw provides for each club. If you want someone to tell you it’s unfair the Broncos play 99% of Friday night slots, you’ll need to go on to Twitter.
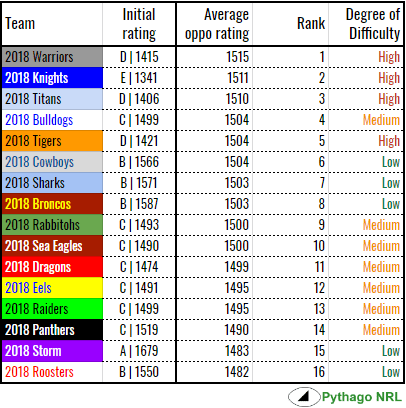
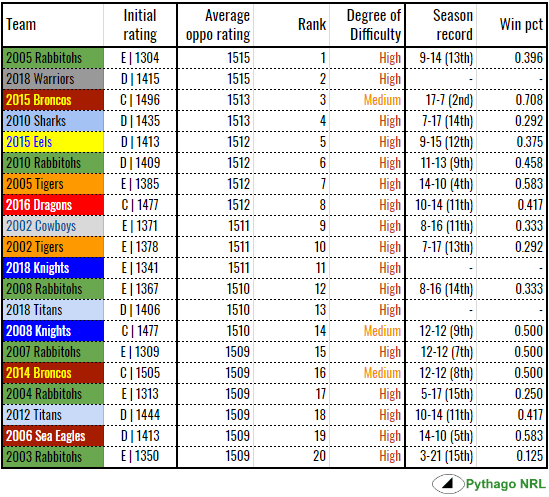
The Warriors have one of the toughest schedules in NRL history (see below), judged by the average strength of their opposition. The New Zealanders have to face four of the top five rated teams twice. That’s before you factor in the fatigue resulting from the most punishing travel schedule.
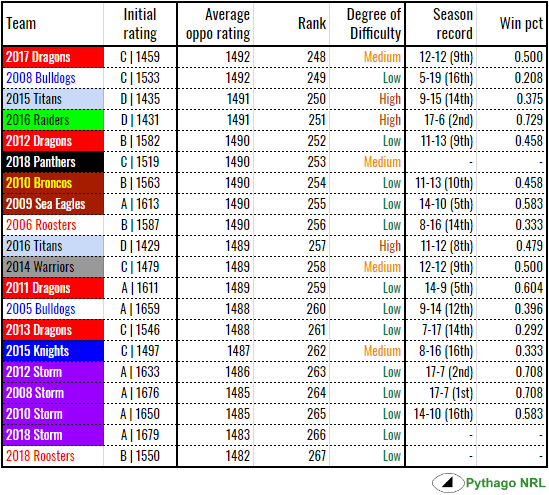
In contrast, the Roosters, whose idea of a long road trip is the hour or two it takes to get to Campbelltown from Bondi, have the easiest draw since 2002. Of the other five top rated teams, Sydney are only playing Brisbane twice. The reigning premiers will have only a slightly more difficult time of it despite playing the Broncos, Sharks and Cowboys twice.
We should view these schedules in context. If your team finishes in the bottom four, by definition they can only play a maximum of 3 x bottom four teams next season. The rest of the league have the opportunity to play 4 x bottom four teams. This makes their schedule look comparatively easy. A similar principle applies in reverse.
All-time softest draws
To provide some perspective, I took a look at every schedule from 2002 to 2017 using Eratosthenes ratings and the same scheme as above.
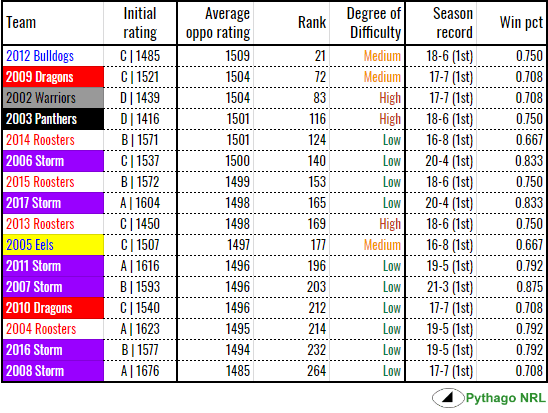
Here’s the twenty hardest draws:
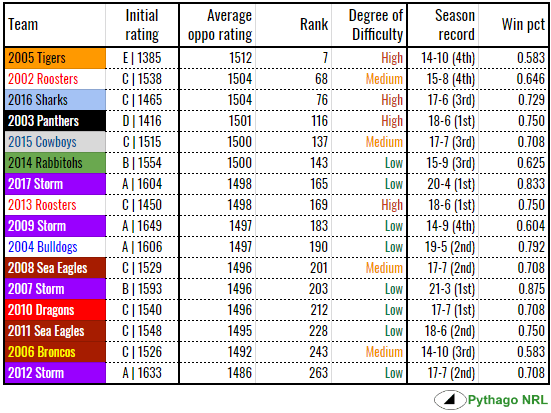
And the twenty softest:
The minor premiers:
And the actual premiers:
It seems that the Storm consistently get handed softer schedules (average rank 202nd, hardest 128th) and the Bunnies get harder ones (average rank 57th, softest 179th) but this is deceptive.
Melbourne’s rating is so high that it makes their schedule look easy. The league average with all sixteen teams is 1500. Without Melbourne, the league average is 1488. Their schedule has an average opposition rating of 1483. So while it’s still slightly below average, as Melbourne can’t play Melbourne, their schedule is always going to look easier than everyone else’s. Newcastle have the same problem in reverse: their 1511 schedule is actually the same as the league average without Newcastle, 1511.
In considering this, it pays to remember that Melbourne have been good for about as long as Souths were bad on their return to the NRL in 2002. Other than that, there aren’t too many definite trends.
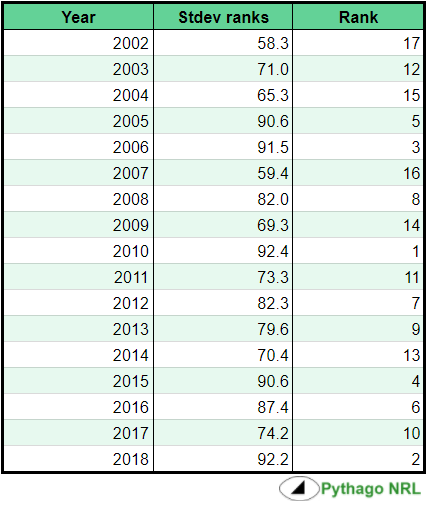
The balance of scheduling changes a lot from year to year. Even on the scale we’re looking at the standard deviation, or spread, of ranks of teams in that year changes a lot. Remember, the larger the standard deviation, the greater the spread. 2018 will be one of the least balanced draws in a few years.
Does it matter?
Sort of but not really.
Here’s a table showing the average of each team’s and their opposition’s ratings for seasons 2002 to 2018.
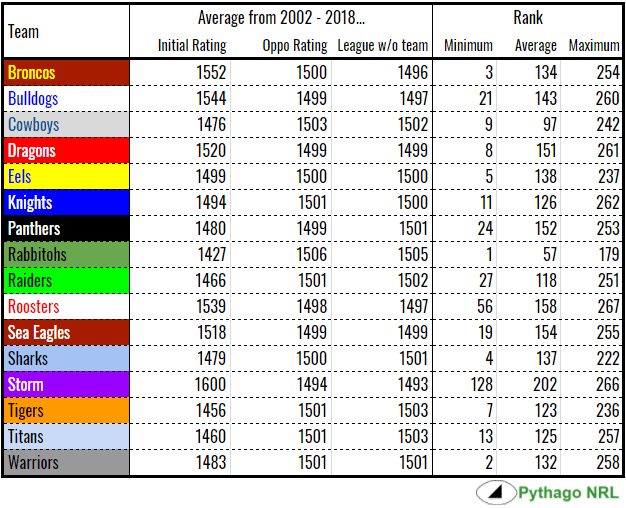
With the notable exception of the Storm and the Rabbitohs, everyone’s oppo rating is within a couple of points of the league average.
In Melbourne’s case, their average is so skewed because they’ve been so good for so long. Their average without their contribution is the lowest of all sixteen teams, making it difficult to give them a schedule with a high degree of difficulty. Souths have the opposite problem.
Most seasons, the difference between the hardest and easiest schedules is about 2-3%. If, like Ryan Buckland, I used Pythagorean expectations, the difference would blow out to about 10%. That kind of gap implies the draw is either responsible for a win every two seasons or two wins every year to the beneficiaries. One seems small for the outrage it causes, the other massive.
The thing is that there’s not a lot of correlation between the difficulty of the draw and the actual season results. In fact, the R-squared between wins and average opposition rating is 0.03, i.e. there is no correlation. The R-squared improves if we compare initial rating to wins or degree of difficulty to initial rating but not by much; we only get 0.12 for both.
That tells me that the supposed difficulty of the draw has little bearing on the actual outcome of the season. The NRL is so evenly matched – particularly over the long run – that the draw is a swing and/or roundabout. The 2015 Broncos had the third hardest draw and were one dropped bomb away from a premiership. The 2005 Tigers were seventh and went one better. Meanwhile, to find a wooden spooner, we have to go to the 2004 Rabbitohs in seventeenth but there are three in the bottom twenty.
The way I see it, day to day things, like injuries and weather, as well as larger considerations, like money, coaching competence and downright luck, have a far larger impact on whether a team wins. In the long run, it all evens out. While it may be frustrating for your losing-record team to be disadvantaged further, unless there are fifteen or thirty games a season, I’m not sure what you want the NRL to do about it.
