

The biggest problem I face in trying to work through rugby league analytics is a lack of useful, reliable, easy to source data to analyse. For this post, I had to do it myself.
I recorded 1,000 sets of six from the 2018 season so far, ranging from a Titans-Warriors pre-season game and finishing during the Titans-Bulldogs game in round 15. A thousand may sound like a lot but given there are about 80 sets of six per game, it’s about a dozen games worth of material. We are working with a relatively small sample size and that the probabilities we estimate may not precisely align with reality. If I had the time and patience (a salary could substitute for time and patience), I could go through the entire history of the NRL and do a better job. This site’s motto is “you get what you pay for”.
But today is not about solving problems once and forever. There are a number of ways to solve a given problem and the techniques and data presented here are hopefully what will be a foundation to build upon. This post is about demonstrating that rugby league can be analysed statistically and useful conclusions can be drawn.

Data, data, data
There are really only four outcomes from a set of six: the half ends, the attacking team scores, the attacking team gets a new set or the ball is turned over to the defending team. That’s it. There are a variety of means to achieve these outcomes but all sets of six end in one of those ways. If we don’t care why a team turns over the ball, just that it happens, rugby league becomes a much simpler beast to attack.
For each set of six, I recorded:
- The attacking team
- The quarter of the game clock the set started in
- The position on the field that the attacking team takes possession of the ball, as measured from their own goal line (rounded to the nearest 5m)
- The result of the set of six, e.g. offensive error, defensive penalty, try, etc
- If the set made it to the fifth tackle, I recorded the location of that and the fifth tackle option (kick, run or run then kick)
I actually wanted to record a few thousand sets of six but it turns out that this kind of thing requires a lot more concentration than I can bring after work and on the weekend and that doing this is quite tedious. Shout out to the stats recorders out there!
You’ll notice that not only is this a small sample size but there’s not a lot of information. I don’t record where the set finishes if the attackers don’t make it to the fifth. I don’t record what tackle the set finishes on. I don’t care who handles the ball or how the attackers make their metres. I don’t care why the penalty was conceded. That’s another level of analysis you could do but given commentators can’t agree on why a penalty is given, I don’t have much chance of recording this information correctly and systematically while staring at my phone on the couch at home.
Each set is treated as an individual quantum and in the dataset, there’s no way to know if the preceding set is actually related to the following. In that sense, none of the games are complete. I didn’t want my analysis to rely on getting information this accurate because I knew it would be too difficult. If you make it too difficult, then the problem seems too big to challenge and you don’t get anywhere.
A brief diversion into expectation
You may recall a post earlier this year looking at xPremierships, or the number of premierships we expected clubs to win. This relied on the concept of statistical expectation, which I explained as follows:
If you have a process which has a range of outcomes, each with a defined value or payout and specified probability, you can calculate the expectation of the outcome of that process.
Example 1: There are six numbers on a die (1, 2, 3, 4, 5 and 6), each at 1 in 6 chance. The expectation of a roll of one die is 1 x 1/6 + 2 x 1/6 + 3 x 1/6 + 4 x 1/6 + 5 x 1/6 + 6 x 1/6 = 3.5. Over the long run of a bunch of independent rolls of the die, the results will average out to 3.5.
Example 2: You bet on red (18 in 38 chance) on roulette which is paying 2 to 1. You lose your money if it lands on anything else (20 in 38). The expectation of profit on the next spin of the wheel with a single dollar bet is 1 x 18/38 + -1 x 20/38 = -0.05. That is, over the long run, you can expect to lose 5c per spin of the wheel.
The post gives a more concrete set of examples to show you what this means. Make sure you understand how this works because the next couple of thousand words rely on it.
What are the odds?
Here’s the raw output of the exercise:
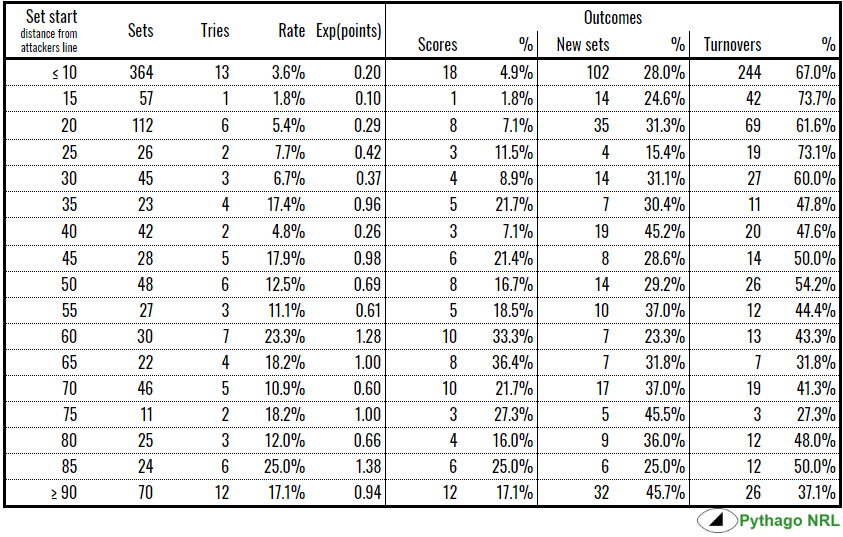
And here it is in convenient graph form:
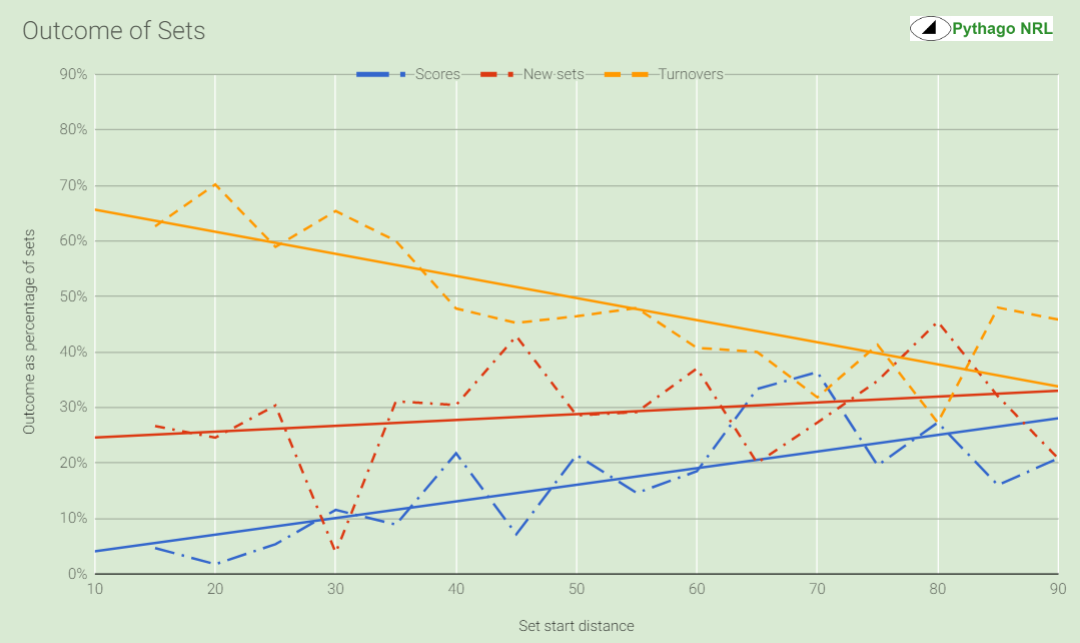
Two “cool” things came out of this.
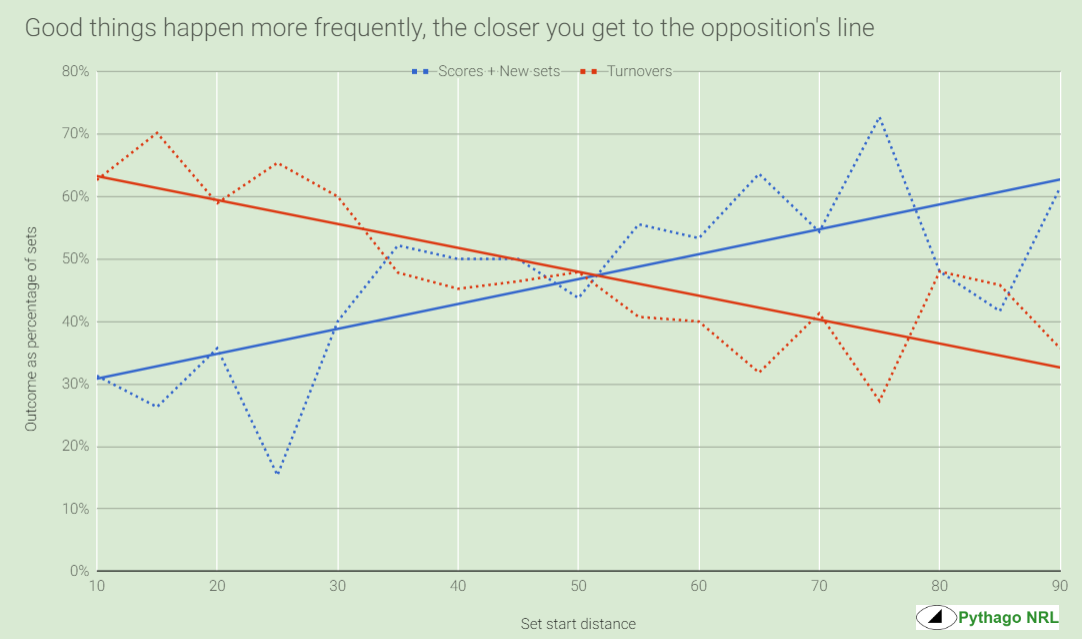
Firstly, if we reduce this to an assessment of good (scores, new sets) versus bad (turnovers) outcomes, we see that there’s a definite correlation between that and the distance that the set starts from the attacker’s try line.
I have no idea if this is meaningful but the idea that turnovers decrease, as a proportion of sets, as you approach the try line was the single most surprising take away from this exercise.
Secondly, while the rate at which tries are scored is subject to noise in the data, it shows a pretty clear, and intuitive, relationship.
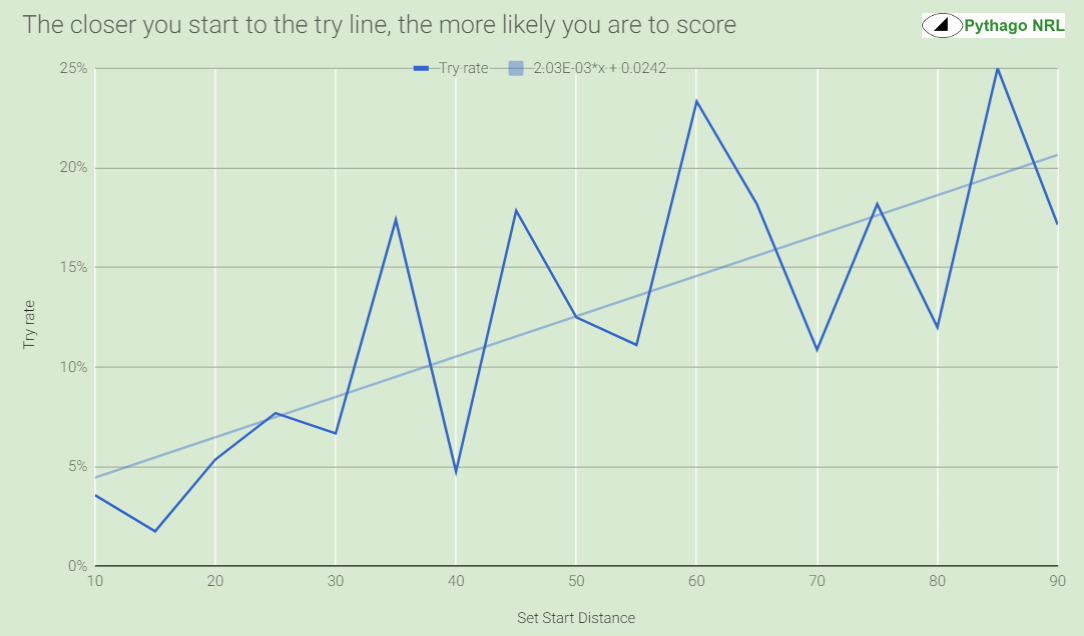
The calculation of expected points (Exp(points)) in the first table is taken by multiplying 5.5 points, which is 4 points for the try plus a 75% league average conversion rate times 2 points, against the rate at which tries were scored from a given starting point. This is the number of points you would expect to score, on average, for every set that starts at this location.
Based on the trendline, we can derive a formula to calculate expected points from tries scored:
Exp(points) = 0.011x + 0.1331
where x is the starting point of the set.
If there’s a turnover in play and your team regains possession on the 43m, I estimate that their expected points for the next set is 0.62. Or, phrased another way, every 9 sets or so starting in this position should yield a try (11% try rate per set).
Further down the field, let’s say 11 metres out from the try line, the formula says every five sets should yield a try (Exp(points) = 1.11, try rate = 20%).
Case study: should you take the two?
Let’s apply some of this data to real world scenarios that bother people.
Scenario: there’s ten minutes left and your team is down by eight. You’ve just been gifted a penalty in front of the sticks, fifteen metres out. It’s a guaranteed two points if you take the two. Should you go for the penalty or go for the try?
Joel Caine thinks so:
He may be right but I believe his reasoning is specious, which drives me up the wall. The again, he may be some sort of maths prodigy:
Anyway, here’s the rate that tries were scored in the dataset by quarter of the game:
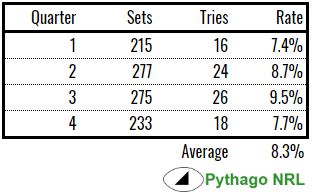
If anything, the probability is slightly lower in the first ten to fifteen minutes as players are still fresh and perhaps higher in the back end of the game due to fatigue. That said, what we see above could easily be noise in the dataset. If I add a couple more tries in the first quarter of the game, then that changes the perception massively, so let’s not get too bogged down in tenths of a percentage.
As an aside, this would actually be relatively easy to demonstrate one way or the other, given that we have the time that tries are scored going back to the dark ages.
Let’s assume that a flat rate of 8% applies because I think the odds of scoring a try are time independent, score independent* and you cannot make a real judgement about a team’s likelihood of scoring based on a given 70 minutes of play. If I watch you roll a die seven times in a row and you never roll a six, do I conclude that you’re incapable of rolling a six or were you just unlucky? Does the likelihood of you rolling a six change because you weren’t able to roll one previously? The answers are “you were unlucky” and “no, of course not, you idiot”. This is known as the gambler’s fallacy.
*Assumption: BuT tHe OpPo DeFeNdErS wOuLd LiFt To PrOtEcT tHe LeAd! Where was that effort earlier? If your players are keeping energy in reserve while letting the oppo score on them, then you’re a shitty coach and the club has bigger problems. By which, of course I mean, we need more data to prove it one way or the other but score independence is the null hypothesis.
The real issue is, if you have ten minutes left to play, you’re going to get five sets of six to score a try (each set chews up 64 seconds of game clock on average) and either find another two points for a draw or jag a second try for the win*.
*Assumption: your team does not concede any more points. If it does, then the game is over because once the conversion and kick off are done, then there’s maybe one or two chances left and you now need twelve to fourteen points.
Your odds of not scoring a try at all in five sets are about 66%. If you do score a try, that’s not enough to tie or win the game. You must score twice. The odds of scoring two or more tries are about 5%, assuming this is a problem that can be resolved with a binomial distribution.
What if I can get another penalty to level the game? Well, let’s say you score a try on your first chance. That leave four chances left to jag a penalty. Of the 225 sets I recorded in the last quarter of the game, about 12.8% ended in a defensive penalty*. The best goal kickers have a conversion rate of 85%, so 11% is the best, and not very realistic, case.
*Assumption: I don’t have records for where the penalties were conceded and it’s likely a large percentage were outside of goal range and had to be taken by kickers that are not as good as James Maloney.
So in the last four sets, you could still score a try (8% on any given set) or get a penalty goal (11% on any given set), leaving you a 57% chance of success of getting at least one more score. Combined with your earlier try at 8%, that’s a 5% chance of levelling or winning the game if you go for the try while eight behind. Getting another shot at a penalty goal is not that useful.
In the other scenario, we take the two* and leave yourself with four sets. The chance of not scoring a try in four attempts is about 72%. So the chance of scoring a try or tries on any set you have left is 28%. Accounting for the conversion, you’ve given yourself somewhere between a one-in-four and a one-in-five chance at least tying the game up by reducing the margin to six.
*Assumption: this should be a certainty buuuttt….
As we know, golden point is a coin toss (sort of, maybe). If extra time really is a 50-50 shot, then taking the two improves your likelihood of victory to the ballpark of 10-15%, depending on how good your kickers are. Don’t take the two, and it’s at best 5%. A factor of two or three is a pretty big difference when you’re clutching at straws.
But the question is a biassed. If you assume the two is a certainty, then the question is: are you more likely to score a single try in four attempts than you are to score two tries (or one try and get another penalty attempt) in five attempts? When you put it that way, it’s the obvious conclusion.
What if the two (or the conversion on the tying try) is achievable but not a certainty? There’s still a pretty good chance you’ll make it. Even the worst NRL kickers have a conversion rate of about 65%. That means for any given shot at a penalty goal, we expect should return of 1.3 points (65% x 2 points). For more analysis of goal kicking rates, see this post.
If you go for it, there’s about a 20% chance you’ll score a try in penalty goal range. A try is worth about 5.5 points, so going for the try should yield 1.1 points. Some may call it simplistic but 1.3 is more than 1.1, so I would go for the goal.
What if you can force repeat sets? I’ve assumed alternating possession but even if you could play ten sets in ten minutes, using this method, the probabilities change but the conclusion doesn’t. What this method doesn’t recognise is that the try rate (probably) changes dramatically upon repeat sets. Three or four sets back-to-back at the end of the game and the defence would be getting tired. I don’t have the data to verify this but if your team is down by eight points, how likely is it that you are able to force repeat sets at will and score two tries in a short period of time? This scenario is possible but qualitatively unlikely.
There’s a reason NFL teams always take the field goal when presented. As they say, never take points off the board.
Whether you agree or not, there are two factors to keep in mind:
- There are over 4,000 games of rugby league just in the NRL’s history alone. That doesn’t include reserve grade, Super League, pre-NRL ARL/NSWRL or any other competition you can think of. There are probably tens, if not hundreds, of thousands of rugby league games played under the current rules and scoring system. Anything that’s a 0.1% chance, will have happened about a hundred times in 100,000 games.
- Because the 0.1% fluke shot coming off is so unusual, it takes precedence in your mind. When asked about great victories of your team, you will naturally think of a less likely event more, because the event’s unlikeliness makes it so memorable, and that affects your perspective of how likely the event was in the first place. You also tend to forget the boring 99.9% of cases where it didn’t come off. This is called the availability heuristic and is responsible for a number of fallacies.
Case study: the short drop out
The tactic of excessively using the short drop out and short kick off has been “pioneered” (in the white man “discovery” sense of the word) by the Walker brothers at the Ipswich Jets. The Bulldogs under Des Hasler used the short drop out in 2017 with absolutely no judgement whatsoever. Some people think it was smart, whereas I point to the finishing position of the 2017 Bulldogs and the comparative lack of premierships for the Jets over the last seven years as evidence to the contrary. I also made the following point:

Let’s work it out, shall we?
Scenario A: Long drop out
Let’s say your team goes for the standard, long drop-out. Under normal circumstances, we would expect the drop out to go 40 to 60 metres. That means the receiving team will take possession 60 to 40 metres from their line (you could use line drop out sets only but it would limit the sample size too much). Below is the table of outcomes for sets commenced between 40 to 60 metres out and their likelihood based on the dataset:
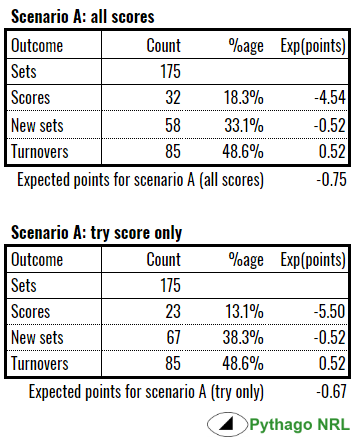
For this exercise, you’re the team dropping out, so any points scored by the attacking team are a negative. Any points you score are a positive.
For the non-scoring sets, I’ve assumed a generic set will take place next. Any given set has an expected point value of about 0.5. This makes sense because there are, on average, about forty points scored in a game and about eighty sets of six contested. Therefore, half a point is scored, on average, for each set played.
I’ve split up the all scores and try score only because they speak to different situations. Your team being up by two with five minutes to go is very different to your team being up by twelve with ten minutes to go. In the latter situation, the receiving team really has to press for a try to stay in the game. In the former, the receiving team may accept a penalty goal or make an attempt at a field goal. The expected point values and probabilities are different for each.
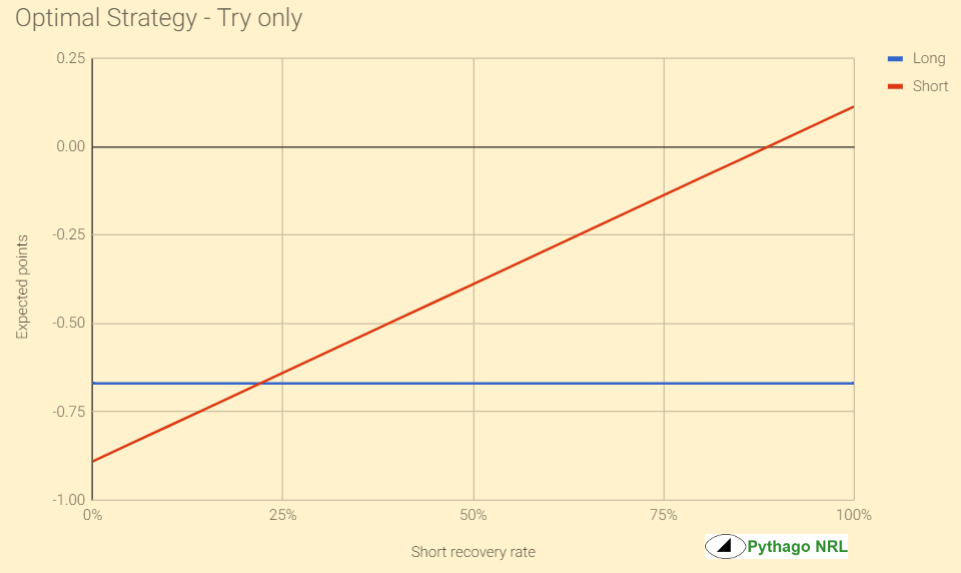
At the end of it, we see that the average long drop out will see the kicking team concede 0.67 points, if the receiving team presses for a try, or 0.75 points, if the receiving team settles for any score.
Scenario B: Short drop out
Your team is, unfortunately, the 2017 Bulldogs. Des Hasler insists you kick a short drop-out. We expect that the kick will go somewhere between 10 and 30 metres to allow your side a chance to contest recovering the ball. That means there are two scenarios: one where your team takes possession about 10 to 30 metres from your line (B1) and another where the receiving team takes possession about 70 to 90 metres from their line (B2).
Scenario B1

The method is largely the same in scenario A, except that if your team recovers the ball, they becoming the attacking team and therefore able to score points, so any expected points are a positive for your team. As you would expect, having possession, even in your own end, is likely to generate points for your team with fairly similar expected points coming out of the maths of 0.12 points per set for any score and 0.11 points per set for tries only.
Scenario B2
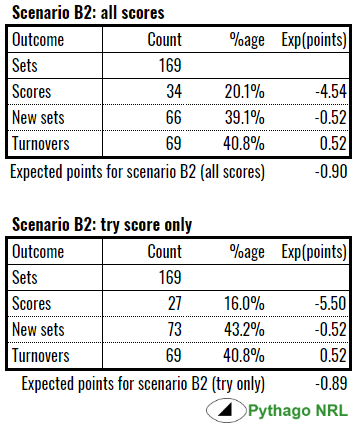
We can see that the expected points your team is going to concede are greater than if you did a long drop out in scenario A. This makes intuitive sense; being closer to the line means the oppo are more likely to score a try or get a feasible shot at goal.
So the big variable is, how often do you recover the ball on a short drop out and does this offset the risk you take by having the opposition closer to the line?
Comparing scenarios
The Bulldogs managed to recover the ball 38% of the time. My non-systematic, subjective observations would suggest it’s about 50% if the receiving team is not expecting the short drop out. But as I saw when the Jets played the Magpies earlier this year, once the receiving team expects the short drop out/kick off, then they team adjust their positioning accordingly and the chance of recovery falls a lot, possibly to close to 0% and the kicking team is relying on a fumble. Whether the long or short drop-out is the optimal strategy, depends on how likely you are to recover the ball.
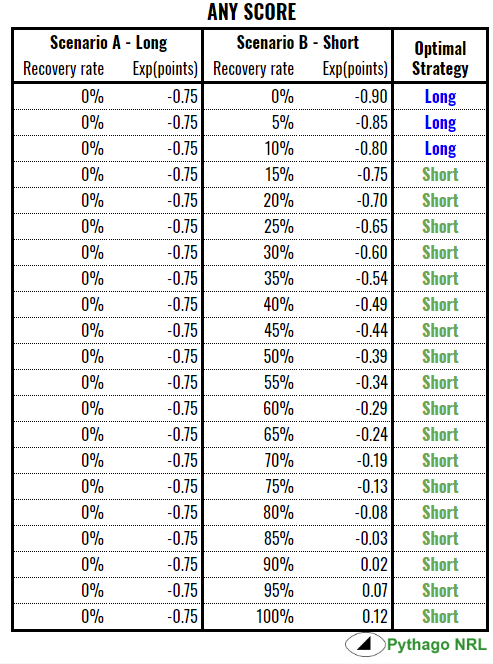
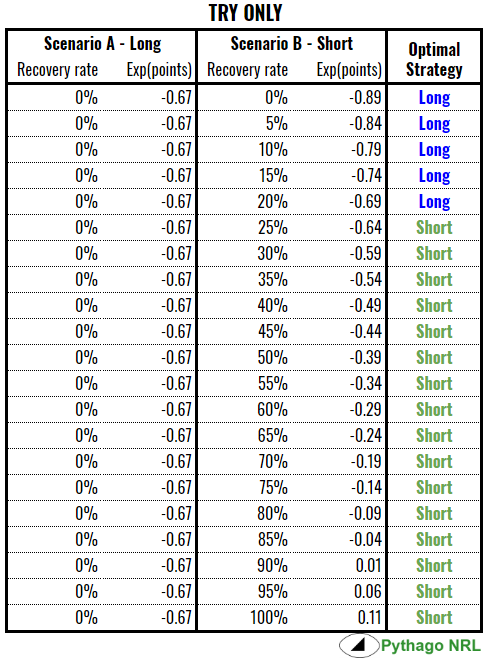
The interesting thing here is that you need a higher rate of recovery to justify a short drop out if the attacking team is likely to press for a try and ignore goals. Ironically, if the game is tighter (say one or two points), going for the short drop out can be the optimal strategy at a lower rate of recovery. That is, even if you are less likely to recover the ball, you should still go for a short drop out because the risk of giving the receiving team possession with more scoring options is bigger than the benefit you will get from recovering possession.
I’ve overlooked two things:
- If the ball goes out on the full or doesn’t travel 10 metres, then the rate of recovery is instantly 0%. It is important that if you are going to use the short drop-out, that you train for it. There’s no point doing it at random, especially if your team is not well positioned to recover the ball and your kicker doesn’t have a level of precision to get the ball to go eleven metres and keep it in the field of play.
- The Jordan Kahu play, which is being on the receiving team but touching the ball before it goes ten metres and conceding a penalty. This is pretty rare and, again, a bit of coaching doesn’t go astray here.
Here it is in graph form. The optimal strategy is the one that concedes the least expected points so is, basically, the top line on each graph:

Based on the trendline rate at which new sets, turnovers and scores occur in the field of play (refer the green graphs from earlier), it is actually possible to build a simple drop out model to determine what the optimal strategy is based on the distance of the kick, the rate of recovery and the expected point values. You can access it here.
Does the level of precision matter?
I’ve talked about how the dataset is not perfect and has flaws. This post is not really about the actual percentages but about demonstrating that a useful framework can be constructed and that a few simplifying assumptions can allow us to create a statistical model for a rugby league game. It is, after all, not rocket science.
With more time and data, you could tune the inputs to be more specific. The drop out model could be player dependent (e.g. Isaako and Austin generally kick further than their rivals but not always, so you could use a probabilistic model), weather dependent (wind speed and direction obviously affects length) and you could implement a recovery rate model to reflect the distance (e.g. less than 10 metres or more than 35m and that recovery rate is zero but in-between?). That said, an improvement of about one-tenth of an expected point would take about thirteen games to be seen as an actual try scored.
I didn’t build a strategy model for this exercise but it would arguably be much more useful. For every assumption I made, there’s enough data out there to verify or improve upon it, I just don’t have the resources to do it. It needn’t even be 100% true or 100% false; there is room to add layers of probabilistic models – verified by evidence – to make the model more complex but also more realistic. For example, you could probably build a reasonable model of fatigue based on stats, e.g. tackles made and missed, errors and metres made, and verifying that against player self-reporting. With a fatigue metric, you can measure the effect this has on the rate at which tries are conceded in a game as time progresses. That can affect your decision making when there’s ten minutes to go. There’s a big difference between that looks like they’re on the ropes and one that is.
It’s all there to be done. If they’re not already doing it, a club has just got to have the guts to pay me to do it for them.
If you’d like to dick around with the data or the drop out model, see this Google sheet.
