

If you’re the Eels, probably a lot more than zero. But I’m getting ahead of myself.
Around the start of the finals last year, The Arc posted the probabilities of each finalist winning the AFL grand final. Some guy on Twitter (let’s call him Bill because I don’t remember who it was and I’m not digging out a throwaway tweet from six months ago) asked if the probabilities had been calculated for all finals series throughout history so we could see how many teams were expected to win against reality. They hadn’t but more on that next week.
I thought, in the true embodiment of the philosophy of this site, “That’s a great idea. I’m gonna do that but for NRL.”
Here’s how this exercise works:
- We take the end of regular season Archimedes (form) Elo ratings
- Plug these into the Finals Stocky, which is a version of the normal Stocky that simulates the finals series instead of the regular season
- Record the premiership probabilities
- Work out how many premierships we expected the club to win
- Compare to the actual premierships won
- Laugh at Parramatta
Sorry, I’m still ahead of myself.
A brief diversion into expectation
If you have a process which has a range of outcomes, each with a defined value or payout and specified probability, you can calculate the expectation of the outcome of that process.
Example 1: There are six numbers on a die (1, 2, 3, 4, 5 and 6), each at 1 in 6 chance. The expectation of a roll of one die is 1 x 1/6 + 2 x 1/6 + 3 x 1/6 + 4 x 1/6 + 5 x 1/6 + 6 x 1/6 = 3.5. Over the long run of a bunch of independent rolls of the die, the results will average out to 3.5.
Example 2: You bet on red (18 in 38 chance) on roulette which is paying 2 to 1. You lose your money if it lands on anything else (20 in 38). The expectation of profit on the next spin of the wheel with a single dollar bet is 1 x 18/38 + -1 x 20/38 = -0.05. That is, over the long run, you can expect to lose 5c per spin of the wheel.
xPremierships
The notion of expected premierships, or xPremierships (or xPrem), is tangentially related to expectation.
In our case, let’s say Cronulla has a 25% chance of winning the 2101 finals series, because it will take them nearly a century to be as competitive again as they were in 2016. If we then re-ran the 2101 series one hundred times over, we would expect the Sharks to win 25 of them. Similarly, if Cronulla is a 20% chance every year from 2104 to 2108, then we would expect them to win one (5 years x 20% = 1 expected premiership).
If you add up the chance each club has of winning the premiership each year, that should give you a pretty good idea of how many premierships we expect that club to win. We can then compare that to the number of actual premierships they won to see if the over- or under-achieved against our expectation.
That’s the premise that Bill put forward, except he called them xFlags which, while a less cumbersome name, we don’t do flags north of the Murray-Darling.
Finals series
The NRL has had three finals systems:
- 1998’s unbearably complicated top ten system for the brief period we had twenty clubs
- 1999 through 2011 used the McIntyre system
- From 2012 on, the NRL has used the same system that the AFL does
The purported reason for the change was to give more advantage to the top four teams. In a rare case of intended consequences, this actually works out. If I run the Finals Stocky with all clubs on equal ratings, we get the following premiership breakdowns.

Bear in mind that I only ran the Finals Stocky a few times (itself only 5,000 simulations) and results tend to vary by a percent or two from run to run but it’s clear that under the current system, the top four are noticeably more likely than the bottom four to win a grand final. Under the old McIntyre system, the top two were heavily advantaged but there was no real reward for finishing third compared to sixth.
To date, no team that has finished outside of the top four on the ladder has won a NRL premiership.
xPremierships, NRL, 1999 – 2017
For the record, I couldn’t be bothered working out how to implement the top ten system in Excel logic, which is why this post only covers 1999 onwards.
You might want to switch from your phone to desktop or tap to open in a new tab for the rest of this.

The table shows the xPremierships for each NRL club from the 1999 season through to last year. It’s coded as follows –
- Finalists in green with percentage of winning the premiership noted, as seen from the end of the regular season
- Non-finalists in red
- Premiership winners in yellow
- Favourite in italics, i.e. the mostly likely to win
and my new favourite stat:
- Chokes in bold, i.e. failed to win premiership, despite having a higher probability of win than the eventual premier with a minimum 25% chance
There are some great bits of trivia in that table. The 2016 Sharks were half as likely to win the premiership than the 2005 Tigers. Cronulla were six times more likely to win in 1999. We think of the Tigers as being the most surprising premiers but this underlines how crap the Sharks were in the run-up to the 2016 finals series, despite having a massive winning streak earlier in the season.
Also in 2005, we had a rare double choke, where both Parramatta and St George Illawarra failed to win the premiership despite heavy favouritism. As it would turn out, neither would even make the grand final.
Melbourne’s 2008 failure to win the premiership – smashed 40-0 by Manly in the grand final no less – is the NRL’s greatest choke, even bigger than the 2001 Eels.
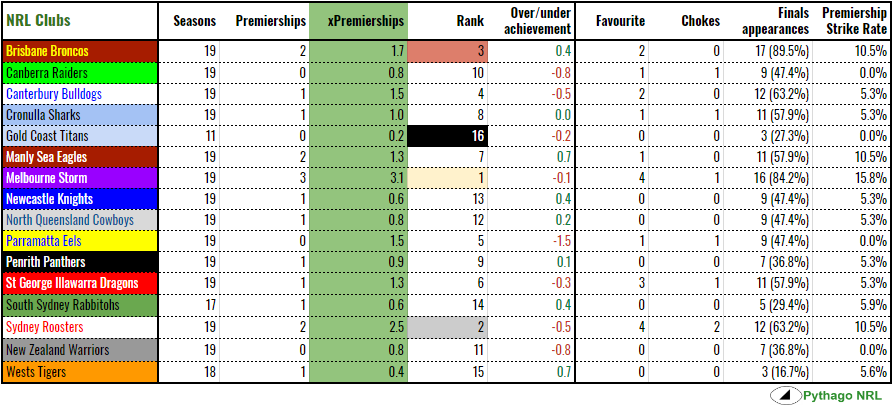
Looking at the green column of the collated table doesn’t tell you much you wouldn’t have already known. The successful clubs – that is, those that make the finals more regularly – rank higher on xPremierships than the less successful ones. More interesting is the over-/under-achievement column, which compares xPremierships to actual premierships. Teams that have overachieved are highlighted in green, while underachievers are in red.
Not surprisingly, Parra are chronic underachievers while Wests, due to relatively few NRL finals appearances, and Manly, thanks to never being that strong (they were favourites once, at only 20%), have more premierships than we would have expected.
The Roosters are the only team to have choked twice, in spite of (or because of) being favourites four times. They finished minor premiers three years running 2013 to 2015 and only have one premiership to show for it. I think it’s fair to cop that as not being up to expectation.
The wider view
This is probably an exercise better suited to AFL, with its superior geographical footprint, but I’ve collated the above on a city basis. Instead of ranking by xPremierships, which Sydney would lead comfortably with its nine teams, I’ve ranked the cities by over-/under-achievement.
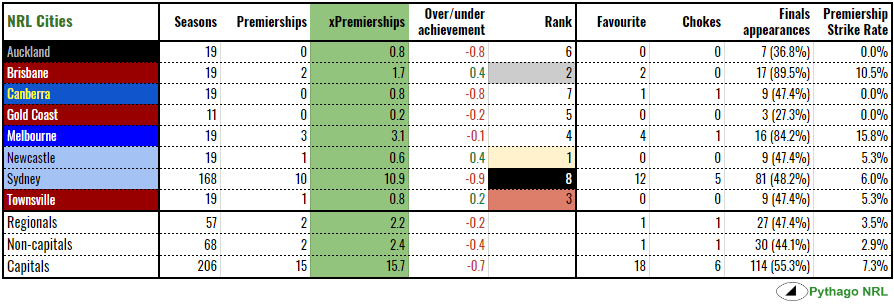
The regionals are Newcastle, Canberra and Townsville while the non-capitals are the same with the Gold Coast thrown in.
Brisbane, Newcastle and Townsville have overachieved. The latter two have a premiership despite relatively few finals appearances at nine each. The Broncos have overachieved by virtue of only having a real chance in years that they won the premiership. The only non-premiership years that rated Brisbane over a 15% chance were 2011 and 2015. Of the remaining fifteen finals appearances, the Broncos either won the premiership (2000, 2006) or were not contenders (every other year).
If Parramatta could somehow be excised from Sydney, the Harbour City would net over-achieve. Auckland and Canberra are going to under-achieve until they can break their respective droughts. The Gold Coast’s three finals appearances didn’t add up to much in the way of expectations, which you can feel is intuitively true.
Given that we are missing two of the nineteen premierships, the over-/under- column should equal to zero but does not. Melbourne only slightly underperform instead of massively over-achieving if they had five real premierships but only 3.1 xPremierships.
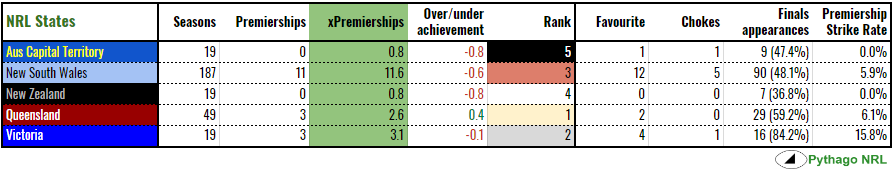
And, this being the sport of State of Origin, I did it at a state level which reveals, as you might have guessed, that Queensland rules and New South Wales drools. The Maroons have three premierships, no chokes and a slightly superior premiership strike rate to their name while the Blues have eleven premierships against 11.6 xPremierships. The ACT and NZ both lag far behind the Australian states.
Next week, given this started as an AFL-based query, we’ll do the same exercise for Aussie rules and see how that changes the city and state levels of achievement.
