

In 2003, the Golden Point system was introduced to decide games that were drawn at full time. Prior to that, instead of the two points awarded to the outright winner, the drawn teams would split the points and take home one competition point each.
Golden Point continues play for a further ten minutes after full time in two five minute halves or until a team scores at least one point, winning the game. A field goal is the most common way these games are decided. If the game has no points scored after the ten minutes, then the game remains drawn and the teams share the points.
I don’t love it and I think it’s a crapshoot.
(Crap-shoot or craps-hoot? One sounds more fun than the other)
Look! Here’s some evidence to suggest it is a craps-hoot.
Since 1998, the home team has won 56.9% of NRL games. In Golden Point deciders, 13.2% of games that go into extra time still end up as draws. Of the remainder, the home team wins 52.1% of the time.
Similarly, the higher rated team by the Euclid system wins Golden Point 51.8% of the time, a figure that includes Golden Point games that still end in a draw. Euclid has historically correctly predicted the outcome 61.8% of the time.
If Golden Point was a natural extension of the game, then we would expect these rates to hold. That is, the home team would still win 56% of the time and Euclid’s favourite would win 61% of games.
The sample size is too small to tell for sure but it sure looks a lot more like a 50-50 coin toss than you might have initially guessed.
What’s interesting is that, despite the above, some teams have a much better record in Golden Point situations than others. The spread in performance is surprising. Look at this table I’ve adapted from Wikipedia (accurate to the end of round 9, 2017):
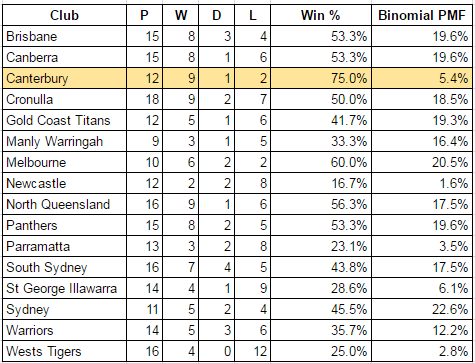
You might think that this contradicts my assertion that Golden Point is a coin toss. Clearly some teams are better than others at dealing with clutch situations. The Bulldogs have won 75% of their Golden Point games while everyone’s favourite whipping boys, the Knights, have only won 16.7%. Ignoring the fact that clutch performance is actually random, the sample size is still very small, ranging from nine to eighteen games per team, spread over fourteen years.
If a Golden Point decider is a 50-50 shot for each team, then let’s do some maths on coin flipping. Because the outcomes of coin flipping follow a binomial distribution, we can calculate how likely it is that you could arrive at a particular Golden Point record.
The Binomial PMF column represents the binomial probability mass function. In short, the Binomial PMF is the probability of a team recording the precise number of wins in the number of games they played, if the odds of each individual win was 50%. Obviously, winning 50% of games is the most likely outcome (the same as you would expect an even mix of heads and tails if you flipped a coin enough times) but it is possible to get other outcomes, including all wins or all losses, from the sampling of games.
For example, there’s a 5.4% chance you’d get exactly nine wins, and 7.3% to get nine or more wins, out of twelve games, each with a 50% chance of winning. Based on that, you’d think it’s unlikely that Canterbury’s record of nine wins from twelve games is down to luck. There’s only a 5% to 7% chance of that record occurring if Golden Point is as random as flipping a coin. They must have earned it.
However, with sixteen teams in the competition, there’s a 37.5%* chance one of the sixteen teams could have that exact record or better. It could just be in this universe that that team is the Bulldogs. In another, it might be the Panthers or the Roosters. Or in another (in fact, 62.5% of them), none.

A one-in-three chance that a team has gone nine from twelve or better in Golden Point situations actually seems a lot more probable than a 5% chance seems on paper. If you accept that, then maybe you can accept that Golden Point is a craps-hoot.
If you’re interested, the probability of going nine from nine based on this assumption is 0.2%. This falls to one in three million for a team to go 18 from 18. But the chance of having one team out of a league of sixteen going 9 from 9 is 3% or 18 from 18 is 0.1%. It’s hard to imagine but it’s not zero.
None of this is conclusive, simply because Golden Point games are still relatively rare, having only occurred slightly more than 100 times since 2003. It’s difficult to establish the underlying trend. Relying on multiverse theory also does not generate much confidence in my hypothesis but I think the analysis definitely points in a direction.
I get why Golden Point is exciting. You never know who’s going to win. Well, until there’s a coin toss for the kick-off and then the receiving team gains a massive advantage. If it were possible, I’d love to see the correlation between teams who win the coin toss and who win the game in extra time. I think (but can’t prove) the coin toss is probably the biggest contributor to its crapshoot nature.
To me, Golden Point hardly seems sporting. If the teams are even at full time, then they should share the spoils. If you want the game to go for lonegr, make the game longer.
*This number is a little bit rubbery. Binomial distributions assume that each trial (coin flip) is independent of the other trials. We know this not to be the case because each team’s record is partly correlated to the others; when one team wins, another loses.
