

Last week we looked at valuing players, specifically Tom Trbojevic, Daly Cherry-Evans and Addin Fonua-Blake, by their contributions to Manly’s winning ways. There were two problems though:
- How do we deal with someone like Marty Taupau? He’s played all of the games this year so we can’t find an understudy to compare him to.
- What if your understudy is pretty good? Cherry-Evans looks like he is comparatively less valuable than his colleagues because Kane Elgey is about 20% more productive at halfback than Brendan Elliot or Toafofoa Sipley were at their respective positions.
We should establish a fixed benchmark to compare players against.
Baseball uses the concept of a “replacement level“. I touched on it briefly last week but the rugby league equivalent would be a top level reserve grader who can be acquired for the league’s minimum salary ($105,000 in 2019). By definition, the replacement level player provides the right value for money for that salary. If a player provides less value, they shouldn’t be in first grade because they can’t justify their pay packet. The trick is to find players who provide more value and then pay them accordingly to win games for your club.
On a side note, I did look into a Wins Above Reserve Grade system in the off-season. It’s not too dissimilar to PPG but it doesn’t work out quite like you’d expect. That’s what happens sometimes when developing new tools, they need some use as part of their evaluation before improvements and problems become obvious.
As part of that, I stipulated that a team of reserve graders could win two of twenty-four rugby league games. I settled on that number by comparing the number of sub-replacement major league baseball teams (that is, with a season winning percentage below .294) as a proportion of all teams in baseball’s modern era (since 1901). The same proportion in rugby league’s modern era (since 1988) yields a win percentage somewhere between 1.5 and two wins in a 24 game schedule.
Using this win percentage and substituting in to the xPPG win percentage formula, we can estimate that a reserve grade team would generate 19.6 production units. A team of players each with a PPG of .070 would generate 19.8 production units. This suggests that the replacement level, measured in PPG, should be set at .070 for individuals.
This is an interesting conclusion because it means a substantial portion of first graders should actually be in reserve grade. Look at the number of players who sit to the left of .070:

Of the 2,611 individual seasons played with at least five games between 2013 and 2018, 485 instances, or 18.5%, averaged less than .070.
There are explanations for this but predominantly, it’s a function of the friction placed on team rosters by the law and NRL regulations. A player can’t simply be disappeared for not being good enough. If a player is past it, his salary may be too large to have him doing nothing (see Darius Boyd, 2019). Some players will be in development (Reed Mahoney at Parramatta), some out of position (Victor Radley as the Roosters’ hooker) and others will simply not have had enough time before being struck down with injury. Gareth Widdop (.022) is currently the least productive Dragon and Corey Norman (.137) the most, but I know which one I’d rather have on my team.
It’s also worth remembering that there is an upper limit on production. There’s only so much that can be done in eighty minutes of football and only so much individual players will be able to do. That puts a ceiling on how many players can be above average at any one time within the one squad. Sometimes a player will end up below average that would thrive in a different environment.
Being below reserve grade is a different matter. That means not only are you not performing, your teammates don’t trust you enough to even feed you the ball. I think that says a lot too.
Each team is different but it’s not particularly surprising to see good teams with lots of productive players and bad teams with an excess of players below the reserve grade threshold.
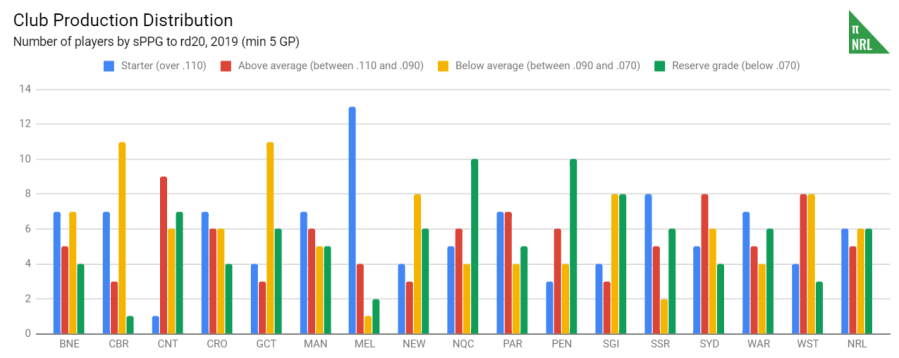
Along with the Titans and Dragons, the Knights have the fewest above average players. The league average is 23 players per team that have played at least five games so far this season, with 11 of those being above average. The aforementioned trio only have seven each.
That could be an issue.

And even if they weren’t expecting to win this year, this is what premiership winners look like the year before:

They still look like premiership winners. While it’s possible to come from nowhere and go on to win it all (the 2005 Tigers are the archetypal team that should not have won a premiership but did), it’s a much more worn path to success to be good in the first instance. While that sounds trite, there’s more to that than you think.
