

Last time, I introduced the concept of Cap. Cap is the ratio of the number of people in the area of a game compared to the number of people who actually turn up over the season. In this case, the lower the Cap (i.e. the more people who attend compared to the size of the local population), the more popular the sport, accounting for the local population and number of games. Cap is mostly for comparative analysis in fairly like-for-like situations but can also be used for very loose estimating, as we will see.
Average attendances can be a bit deceiving: AFL teams play 11 home games, NRL 12, A-League 13 or 14 and Super Rugby only 7 or 8. If, for argument’s sake, the Roar and the Reds have average attendances of 12,000 in a given year, a lot more people actually turned out for Roar games because they played nearly twice as many. If ticket prices are the same, that would also mean Roar fans spent a lot more money. Cap accounts for this by using the total gate receipts for a given year.
Cap has its limitations. To take an example from abroad, New York has two NFL teams. They play in the same home stadium at Meadowlands in New Jersey, taking alternating weekends. The stadium holds around 85,000 and the Jets and Giants average about 78,000 per game. Over 16 games, that’s about 1.25 million attendees but the New York City metropolitan area is home to around 17 million people. That puts NFL in New York’s Cap at 13.6. This would put the NFL in New York on par with the A-League in Brisbane (approx. 11) or Perth (approx. 17).
The relatively high Cap is not due to a lack of popularity of NFL in New York but the constraint is that the stadium is very close to capacity every game. Its also expensive and not that easy to get to from most boroughs. In this case, TV ratings would probably be a better proxy for popularity but these are harder to track down reliably over time. Seeing as we don’t seem to have this capacity constraint in NRL or AFL, we shall proceed as is, bearing in mind we have to be at least comparing fruit to fruit for Cap to have some meaning.
Let’s look at the historical popularity of each code first. What data do we have? AFL Tables has attendances for rugby league and AFL dating back to 1957. This ABS data series has irregular population data going back to the late 18th century but has regular data for the capitals through most the 20th century.
We can then reliably calculate Cap from the start of our attendance dataset in 1957 to 1982, when both leagues expanded out of Melbourne and Sydney respectively (the VFL into Sydney and the NSWRL into Woolongong and Canberra).
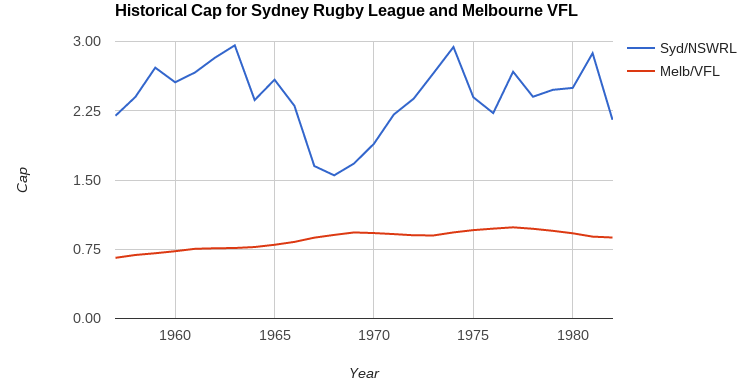
So maybe that’s not that interesting. We knew that the VFL was more popular in Melbourne than rugby league was (and is) in Sydney and now we can demonstrate that that’s more or less always been the case, even accounting for growth in population of each city.
If I may advance an anthropological hypothesis to explain this, when people move to Melbourne, they are immediately absorbed into VFL fandom as a rite of passage to becoming a Melbournian. Having a team, and showing up to support them, is a core part of being accepted by the Melbourne community. Of course, if you were born in Melbourne, you probably inherit a club in the way most people used to inherit a religion. That means the Cap doesn’t change much, although it has a slight upward trend, as more people in Melbourne means more people at games.
In contrast, while rugby league is popular in Sydney, it doesn’t have the same cultural cachet. You can be a Sydneysider and not that interested in league. I would also speculate that the league/union split plays a role here. Traditionally, league is for the working class and union for the rich. If you added more rich people to Sydney, you probably wouldn’t have seen much of a change in attendance at NSWRL games.
At the very least, the numbers suggest a significant difference in the way each city approaches “its” code; Sydney keeps rugby league at half an arm’s length while Melbourne firmly embraces Aussie rules. We may have always known that intuitively but there’s some quantified evidence.
This is just the start to demonstrate the concept. Next week, we’re heading north to Brisbane to see what the Broncos, Lions and Bears have been up to.
