Results
![]() Parramatta 30 (14-8) d
Parramatta 30 (14-8) d ![]() Gold Coast 8 (7-15)
Gold Coast 8 (7-15)
![]() South Sydney 36 (9-13) d
South Sydney 36 (9-13) d ![]() New Zealand 18 (7-15)
New Zealand 18 (7-15)
![]() Brisbane 24 (15-7) d
Brisbane 24 (15-7) d ![]() St George Illawarra 12 (11-11)
St George Illawarra 12 (11-11)
![]() Melbourne 44 (18-4) d
Melbourne 44 (18-4) d ![]() Newcastle 12 (5-17)
Newcastle 12 (5-17)
![]() Sydney City 22 (15-7) d
Sydney City 22 (15-7) d ![]() Wests Tigers 18 (6-16)
Wests Tigers 18 (6-16)
![]() Cronulla 26 (14-8) d
Cronulla 26 (14-8) d ![]() North Queensland 16 (12-10)
North Queensland 16 (12-10)
 Penrith 26 (13-9) d
 ![]() Canberra 22 (10-12)
Canberra 22 (10-12)
![]() Canterbury 30 (8-14) d
Canterbury 30 (8-14) d ![]() Manly 16 (12-10)
Manly 16 (12-10)
Collated Ladder
Now to look ahead to see what the Collated Ladder has predicted for the final standings of the season.
Unsurprisingly, the Collated Ladder is starting to closely resemble the actual ladder. The top six are pretty well safe now and I’d be surprised if their positions change much between now and the end of the season.
Due to some shenanigans in the Stocky (which I elaborate on below), positions 7 through 10 have changed rather significantly from last week, particularly if you’re from North Queensland or the northern beaches of Sydney. Points difference is going to be extremely important to secure the last two finals spots. Here’s what the draw has for the teams in the firing line:
- Dragons: Panthers, then Bulldogs
- Raiders: Knights, then Storm
- Sea Eagles: Warriors, then Panthers
- Cowboys: Tigers, then Broncos
Given the topsy-turvy form on display in recent weeks (e.g. Tigers, Bulldogs, Knights winning), there’s not what you would call any gimmes in that lot, especially given all four contenders are struggling for form. Undoubtedly, something resembling luck will come into it.

Probabilities Matrix
The Stocky can give us the probability of specific season outcomes so you can see how your team is tracking to win the minor premiership, make the finals or avoid the wooden spoon.
It’s the end of a long season and mistakes are starting to creep in. I should have picked up on it last week when Newcastle were 94% for winning the wooden spoon – which seemed harsh given the form they were on – and Melbourne were only 70% for winning the minor premiership – which given their rivals were only still in with a chance if everything went wrong for the Storm and everything went right for them. I did some troubleshooting and fixed the problem (some of the games were out of order in the Stocky, so it wasn’t counting up the win totals correctly) but now the last few rounds of projections are compromised somewhat. And here I was worrying I wouldn’t have anything to write about this week.
What we knew from about the time the Dragons collapsed has come to pass: Melbourne are minor premiers. Newcastle are giving not winning the wooden spoon a good shake but with a game against a Canberra side desperate to make the finals and salvage their season and Cronulla, it’s a tall order. The Tigers and Bulldogs are just as likely to win games at the moment.
We have six certs for the finals: Brisbane, Cronulla, Melbourne, Parramatta, Penrith and Sydney City. We have two favourites for the last two spots in Canberra and Manly (in contrast to the Collated Ladder, this section doesn’t factor in points difference) and two outsiders in North Queensland and St George Illawarra. Because the outcome is dependent on the result of a handful games and the Stocky is good at dealing with large numbers of games, this analysis is getting less and less useful. Your guess is as good as mine.

Finals Matrix
We’re getting closer to the end of the season and the clubs are shaping into two camps of who will and who will not be there in September. The Stocky has been modified to run it’s magic on the finals series for two scenarios:
- Inputs based on today’s ratings for the top eight based on today’s ladder positions
- Inputs based on the Stocky’s projected end of season rating and the Collated Ladder’s top eight
The below table shows the likelihood of each team reaching a given round of the finals based on these scenarios. Teams with a line through them have a slim-to-no chance in either scenario of finishing in the top eight, let alone featuring as more than elimination final speedbumps.

It was only a few weeks ago that it seemed markets were underestimating the Cowboys winning the premiership but now they’re at significant risk of not even making the finals. My confidence in them was misplaced. It should have been focused instead on the Panthers who are roughies, based on current form, of going all the way. Penrith will have to be extremely lucky. They are likely to face the Roosters or Sharks (depending on where they actually finish) in the semis and then the Storm or Broncos in the prelims. Not an easy road to a grand final for any team.
At the business end, its the Storm and Broncos still. The Storm’s flogging of the Knights has boosted their rating, so they are looking stronger than last week. I still think it’ll be roughly 50/50 for whoever makes it to the grand final but it’s pretty likely now that we’ll be crowning the Storm premiers come October 1.
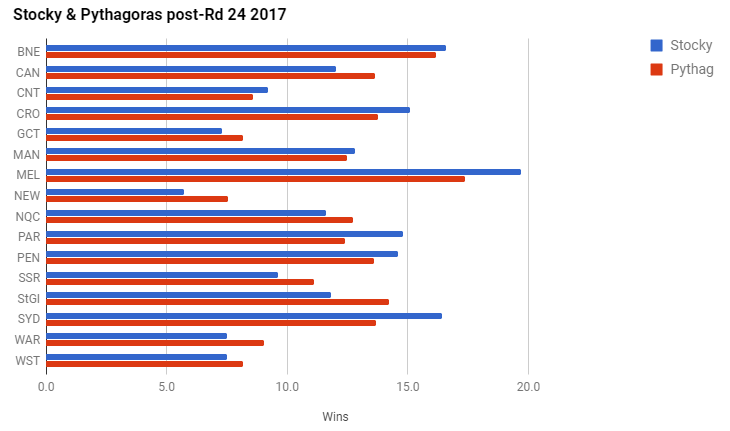
Projected Wins
This table and graph shows the number of predicted wins this season for each club using the Stocky and Pythagorean expectation. The numbers should align to an extent but a significant mismatch can indicate a possible imminent change in performance.
The immediate outlook compares the projected wins from the Stocky and Pythag to approximately assess how each team might go in the foreseeable future. It assumes that the Stocky is more accurate than Pythagoras. If Stocky is higher than Pythag, more wins by bigger margins are in the offing. If the Pythag is higher, then more losses or narrow wins might be ahead. To be clear, this is very approximate and has not been tested.