

Last week, we took a look at estimating the number of premierships we expected NRL teams to have won versus the number of premierships they actually won. This was spurred by a Twitter query from AFL fan, Bill (whose name I don’t remember and won’t be searching for), who asked the same question of someone else but about AFL.
Well Bill, this week, I did it for you.
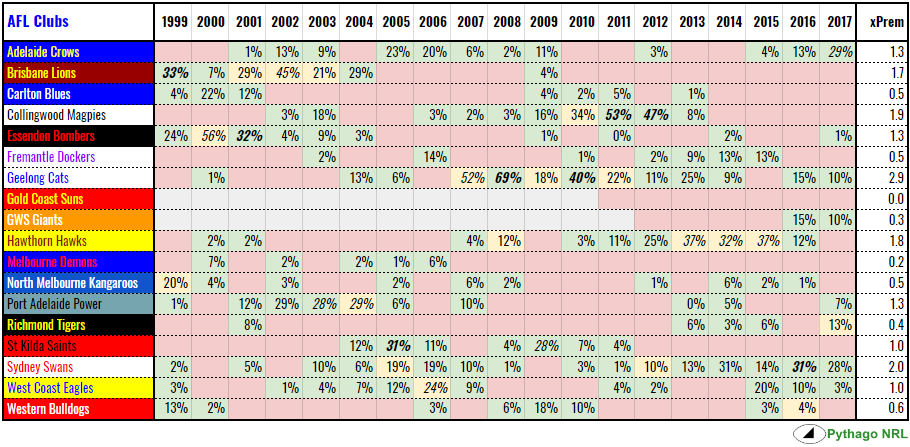
xPremierships, AFL, 1999 – 2017
I did the same analysis as last week but with AFL clubs and Elo ratings from The Arc. I won’t repeat the in-depth explanation I put up last week, suffice to say:
- We take the end of regular season Elo ratings from The Arc.
- Plug these into the Finals Stocky, which is a version of the normal Stocky that simulates the finals series instead of the regular season
- Record the premiership probabilities
- Work out how many premierships we expected the club to win
- Compare to the actual premierships won
- Laugh at the AFL equivalent of Parramatta
Where a team is given odds of winning a premiership, we call this the xPremiership (short for ‘expected premierships’). If a team has a 30% in 2002, then if we ran the 2002 finals one hundred times over, that team should win 30 premierships. Below is the xPremiership table for AFL teams 1999 through 2017, with the following code:
- Finalists in green with percentage of winning the premiership noted, as seen from the end of the regular season
- Non-finalists in red
- Premiership winners in yellow
- Favourite in italics, i.e. the mostly likely to win
- Chokes in bold, i.e. failed to win premiership, despite having a higher probability of win than premier with a minimum 30% chance
I don’t profess to be an AFL expert, or even a fan, so I won’t attempt to comment, put any context around the outcomes or attempt any “jokes”. It would be really unfortunate if I made mistake, wasn’t familiar enough with the sport to spot it and then made a dumbass joke on that basis.
We follow the calculation of xPrem with comparison to actual premierships won, calculate the over/under achievement and a premiership strike rate (actual premierships per season played). These are then collated for each AFL city and then each AFL state.
Consider switching to a desktop or tap the images to open in a new tab if it’s too small to read.


A few observations
Elo ratings
Because The Arc’s rating system is quite different to our own Archimedes system and because AFL is different to rugby league, there is a significantly different spread of ratings across finals contenders in the AFL. They are typically above the 1500 average, as with our own ratings, but the AFL tends to have a greater gap between the top and the average.
For example, the top rated NRL team at the end of any regular season from ’99 to ’17 was Manly on 1704. There were eight AFL examples that exceeded this, with the top going to 2011 Collingwood on 1788 (or thereabouts, I wasn’t super precise in recording the exact rating).
The result of having higher ratings is that the Stocky assigns a much greater probability that highly rated teams will win the premiership when compared to their NRL counterparts. Accordingly, I have tweaked the AFL definition of a ‘choke’ to be any team that is more heavily favoured than the premiership winner, with a minimum of 30% chance (instead of 25% for NRL).
Adelaide
The Crows have an underachievement of -1.34. That is, they were expected to win 1.34 more premierships than they have from ’99 to ’17 (zero). This is a little unfair as the Crows have indeed won two premierships, in 1997 and 1998. If the time series extended back to ’97, and assuming that each campaign would be roughly worth 0.3 xPrem, giving a total xPrem for 1997 to 2017 of 1.94 and a slight over-achievement. This is just something to keep in mind and affects all prior premiers, depending on how far back you think this should go.
I will say that pushing this line for the likes of Parramatta stretches the argument to breaking point. The Eels’ last premiership was in 1986, predating the interstate expansion of the VFL and NSWRL and, indeed, the invention of numbers.
The wider view
The main reason I went through this exercise was to see how the combined AFL and NRL xPremierships looked. NRL hasn’t had a presence in Adelaide since 1998 and in Perth since 1997, so the NRL city list looks a little forlorn. Meanwhile, the AFL’s teams are only located in the six biggest cities in Australia plus Geelong, with no real regional or international presence.

The regionals are, as with the NRL, Townsville, Newcastle and Canberra. The non-capitals are the regionals plus Geelong and Gold Coast.
Based on the combined cities, Melbourne, Brisbane and Geelong are the nation’s top sporting cities. No surprises there. The three have the highest premiership strike rate over 1999 to 2017.
Brisbane leads the country on over-/under-achievement and, irrespective of how far you stretched the timeline, I feel that the suckiness of the Bears through the 1990s would be offset by the triumphalism of the Broncos through that same period. Melbourne ranks second on both achievement and xPremierships, which is impressive considering the large sample size of 190 seasons yielding twelve premiers.
Sydney technically has the most xPremierships but, unlike Melbourne, has not over-achieved. Note that Parramatta has underachieved to the tune of 1.5 xPremierships with Sydney as a whole underachieving by 1.2 (-0.9 for NRL clubs only). While the Swans have more or less held their own, the Giants are also letting the good people of the western suburbs down.
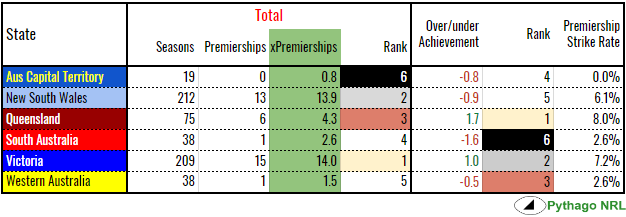
Queensland, with one-third of the number of seasons played under its belt, has managed to bring home six premierships, roughly half the number of New South Wales. The state has net over-achieved to the tune of 1.7 xPremierships.
Victoria has the most real and expected premierships, with fifteen and fourteen respectively, the second best over-achievement behind Queensland and a similar position on the premiership strike rate standings. Premierships to the Swans, Giants and/or Roosters over the coming years would close the gap between the two biggest states.
We’ve already discussed Adelaide’s combined under-achievement, which parlays straight into South Australia as a state. Western Australia hasn’t drawn much attention due to the single premiership, won by West Coast in 2006 who have exactly one xPremiership, and the relatively lacklustre performance by the Dockers in September.
All-club rankings
If you want to see how all the clubs stack up against each other on the key metrics of xPremierships, Over/Under Achievement and Finals Strike Rate, the following three tables are for you.


If you’re particularly intrepid, you could add AFLW, BBL, NBL, ABL, A-League, Super Netball and the slightly less Super Rugby to the list or go back to the late 80s when national leagues in the big codes became a thing but I won’t be the one to do it. Godspeed to he or she who chooses to do so.
For me, I’ve done my annual AFL/NRL crossover and now it’s back to regular programming.
