

A big thank you to Lorna Brown (@_Lorna_Brown) who provided me with the dataset and whose ongoing updates to the same mean that we should be able to do some form of Super League player analysis. She has – presumably through some sort of black magic and/or competence with programming – managed to scrape a far more complete dataset out of the SL website than I managed to in previous attempts.
In short, a Risman is an English Super League equivalent to a Taylor. That is, it is a unit of measurement of rugby league production. Production is the accumulation of valuable work done on field as measured by traditional statistics.
The Risman, as a unit of production, is named for Gus Risman. He is a player whose name has largely stuck in my head due to Tony Collins’ podcast, Rugby Reloaded, wherein Collins makes the case that Risman is one of the all time great footballers of any code.
Gus Risman was one of the greatest of Cardiff’s rugby codebreakers. The son of immigrants who grew up in Tiger Bay, he played top-class rugby league for more than a quarter of a century, was a Championship and Challenge Cup winner with two clubs, and captained the 1946 Lions. Not only that, but he also captained the Wales in war-time rugby union internationals while a rugby league player.
Rugby Reloaded #138
As with Dave Taylor, the unit of production is named for a player who can do it all.

The Risman is derived by running linear regressions to confirm which statistics from the Super League dataset correlate with winning percentage. The stats get distributed in to buckets and we review the success of teams achieving those statistics (minimum ten games in the bucket). The result is that tries, try assists, missed tackles, tackle busts, metres, clean breaks and errors (negative) have significant correlations with winning. This is considerably less than the NRL dataset offers, which is why I’ve opted to give these production units a different name; Rismans don’t quite measure the same stuff as Taylors.
We multiply the stat by the slope of the trendline calculated in the regression and a weighting proportional to its correlation to winning (higher the correlation, the higher the weighting) and then by 1000.
Through this product of slope and weighting, we develop a series of equivalences between stats and can compare this across leagues. The following shows the quantity of each stat a player needs to accumulate to be equal to the same production as scoring one try for the 2021 season. The NRL’s values are calculated on the dataset of the five previous seasons, while the others are based on the three previous seasons (State Cups just roll over what the weightings should have been for 2020 to 2021, given they didn’t play last year).
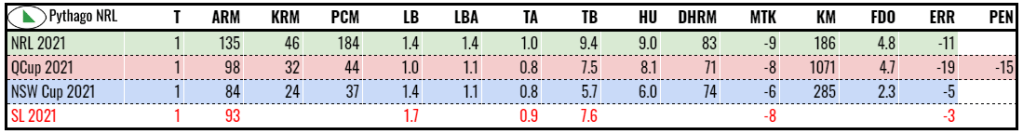
For the record, a try is worth 8.7 Taylors in the NRL, 8.4 Ty in QCup, 7.5 Ty in NSW Cup but a whopping 17.3 Rismans in Super League. This, of course, doesn’t mean anything as Taylors and Rismans have no real world value.
Due to the limitations of the dataset, we can only calculate raw production. Without positional information or time on field, it is not possible to calculate more exotic ratings like an English TPR equivalent, Wins Above Reserve Grade or undertake pre-season projections.
Raw production is still somewhat useful and if nothing else, I think it will likely come in handy for assessing squad strength at the next World Cup. Teams with superior production, as calculated post-game, win 90% of their games.
The average player generates approximately 20 Rismans per game and for players with fewer than ten games, this figure is used until a reasonable sample size can be drawn upon for that player. Based on the actual 17 fielded, teams with the superior expected Rismans, as estimated pre-game by the sum of each player’s prior career average Rismans per game, has a 63.8% successful tipping rate (n=131). This is comparable to using Taylors in the NRL. Using the same formula for the NRL and the above, we can estimate a pre-game winning probability for a given line-up (re-deriving this formula based on the small SL sample meant that the team with more expected Rismans had a lower winning probability when teams were closely matched, which doesn’t make sense).
I posted a leaderboard of players by total Rismans up to round 5 of the Super League. As a not particularly close observer of that part of the game – I still perhaps have a better idea of what’s going in England than in NSW Cup – most of the top twenty at least rang bells as players I’d heard of.
I would have included an update for round 6 but the Super League website does not have any stats listed for the Leeds-Wakefield game, except for who scored the tries. So we must bear in mind that the dataset has some fairly significant limitations, not just in scope, but in completeness. For example, some of the Qualifiers games have been included but a lot, particularly those involving Championship teams, were not. Stats avilability for finals games seems to be hit and miss.
There’s also probably something to be said for different positions accumulating different typical quantities of production but without an independent arbiter of who plays what position, I’m choosing to be blind to this because I refuse to do this manually.
Nonetheless, here’s the all-time (2017 to 2021 round 6) Risman leaderboard.
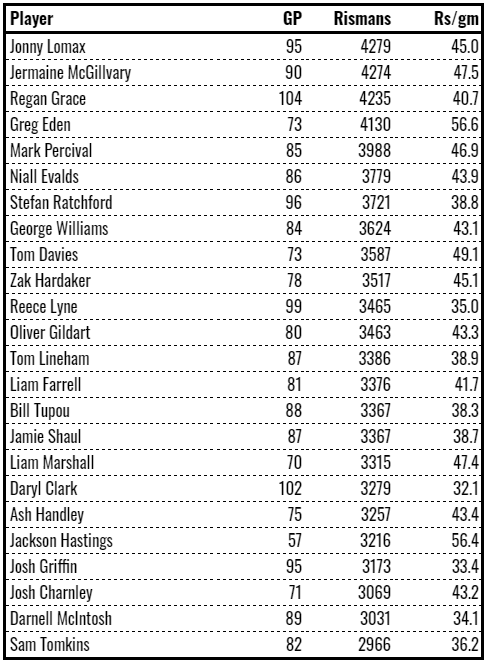
As a couple of reference points, George Williams’ 43.1 Rs/gm has translated into a TPR of .119 at NRL level. This should be exciting for Tigers fans, as Oliver Gildart will presumably perform at a similar level when he joins Wests next year based on his 43.3 Rs/gm. Undermining that somewhat is Jackson Hastings’ 56.4 Rs/gm, the second highest of any player with at least 50 games, behind Greg Eden, compared to his career .052 TPR in the NRL and .080 TPR in NSW Cup. Hastings is also en route to the Tigers in 2022. Whether a real correspondence between different leagues’ ratings can be derived will probably depend on sourcing more information to bolster the dataset but it should be interesting to see how those signings pan out in the meantime.
