

For the third season in a row, I’m changing the player rating system. We mourn the passing of Statscore (not really) and PPG (again, not really) as we slowly converge on to a system that I can take for granted and don’t have to refine any further.
The core of the system hasn’t changed. The proposition is that there are important and unimportant statistics and that counting the important ones provides information about players and teams and can be predictive.
PPG was useful, and development and application through 2019 demonstrated that:
- The Renaissance of South Sydney
- What makes a million dollar NRL player?
- Rugby league’s replacement player
- The Art of Projection
- Mitchell Pearce saved Nathan Brown’s career
The last one should be taught in universities as a perfect example of ringing the bell at the top. Sheer narrative power subsequently forced Pearce back to mean and Brown onto the compost heap.
The mechanics of PPG have been preserved through TPR. My biggest issue is that when I wrote about production (that is, the accumulation of useful statistics), I didn’t have any units to work with. I originally didn’t think this would be a problem but it would make some things clearer if I did have units. So I took a leaf from the sciences and landed on naming it after the man that could do it all, David “Coal Train” Taylor.
“PPG”, which was Production – and not Points – Per Game, doesn’t make much sense now, so that’s been punted and replaced with TPR, or Taylor Player Rating. There has been a substantial change in the way I’d calculated WARG in the primer at the start of 2019 and the way I calculated it in Rugby league’s replacement player at the end. The latter method is now canonical but the name is going to stick.
In brief, TPR and WARG are derived through the following six steps:
- Run linear regressions to confirm which statistics correlate with winning percentage. The stats get distributed in to buckets and we review the success of teams achieving those statistics. One crucial change was to exclude any buckets from the regression with fewer than ten games in it. We end up with tries, running metres, kick return metres, post-contact metres, line breaks, line break assists, try assists, tackle busts, hit ups, dummy half run metres, missed tackles (negative), kick metres, forced drop outs, errors (negative) and, in Queensland only, penalties (negative) as having significant correlations out of the data provided by the NRL.
- Take the slope of the trendline calculated in the regression and weight it by its correlation (higher the correlation, the higher the weighting). Through this weighting, we develop a series of equivalences between stats. The below is shows the quantities required of each stat to be equivalent to one try in 2020:
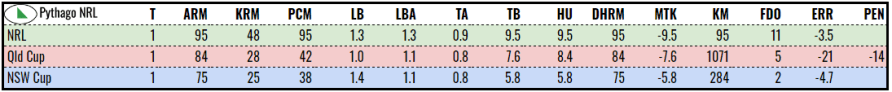
- Players who accumulate these statistics are said to be generating production, which is now measured in Taylors, and is the product of the weighting/slope multiplied by the quantity of stats accumulated multiplied by 1000. However, due to the limitations of the statistics, some positions on the field generate significantly more Taylors than others.
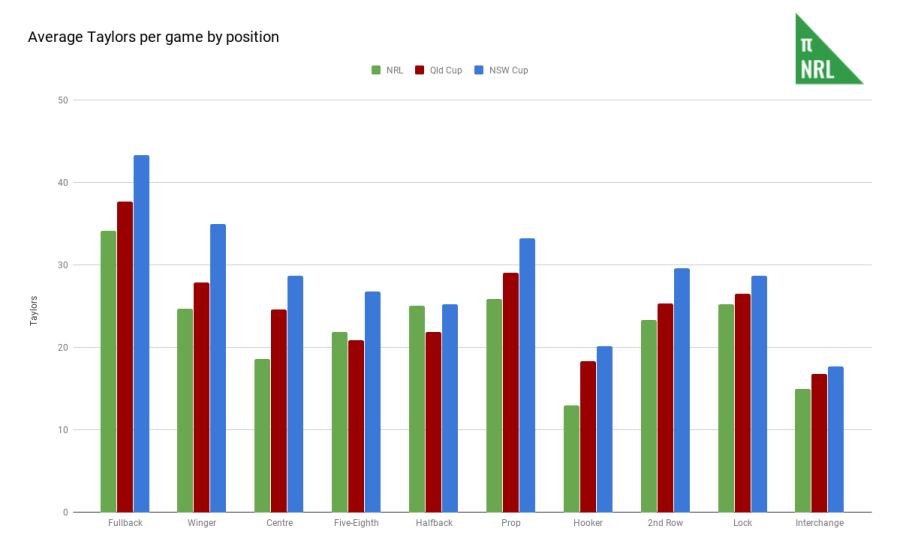
- To combat this, the production generated each game is then compared to the average production generated at that position (averaging previous 5 seasons of data in NRL, 3 seasons for State Cup). We make the same adjustments for time on field as in PPG and then divide by 10 for aesthetic purposes. The resulting number is the Taylor Player Rating, or TPR.
- We derive a formula for estimating win probability based on production for each competition and then substitute in a winning percentage of .083 (or two wins in twenty-four games, per the previous definition of a replacement-level team) and estimate the amount of production created by a team of fringe players against the competition average. This gives us a TPR that we can set replacement level at. The Taylors created over and above replacement level is added to the notional replacement level team’s production and the increase in winning probability is attributed to that player as a Win Above Reserve Grade, or WARG. Replacement level in TPR for the NRL is .057, Queensland is .072 and NSW is .070. The career WARG leaders are currently:

- Finally, we go back and check that it all makes sense by confirming that TPR has some predictive power (~61% successful tipping rate, head-to-head) and there’s a correlation with team performance (~0.60 r-squared for team season production against team winning percentage).
For a more in-depth explanation, you can refer back to the original PPG primer. The differences between last year’s system and this year’s are slight and, for most intents and purposes, PPG and TPR are equivalent. Some of the changes are small in impact but important.
The most obvious change is the addition of NSW Cup data to the Queensland Cup and NRL datasets. This was driven by my interest in assessing the farm systems of each NRL club and you can’t make a decent fist of that if you’re missing twelve feeder clubs from the picture. It will also allow me to better test talent identification in the lower levels if I have more talents to identify and to better set expectations of players as they move between competitions.
For the most recent seasons, TPR only uses past data to calculate its variables, whereas PPG used all of the data available and created a false sense of success. A system that uses 2018 data to create after-the-fact predictions for the 2018 season isn’t going to give you an accurate view of how it will perform in 2019.
Finally, projecting player performance into the future is a pretty powerful concept, even if the tools for doing so are limited. I went back and re-derived all of the reversion-to-mean formulas used in The Art of Projection. It turns out that the constants for the projection formula don’t change much between seasons, so this is fixed across the datasets for now. It also turns out adjustments for age and experience are different and largely useless under the TPR system, such is the ephemera of statistical analysis.
One application for projections is that I’ll be able to run season simulations using the winning probability formula and team production that will be able to measure the impact of including or excluding a player on the outcome of a team’s season. It may not be super-accurate (the projections have large average errors) but it will be interesting. I also like the idea that out- or under-performance of projections as an assessment of coaching.
Finally, to reiterate things that I think are important caveats: TPR is a value-over-average rate statistic, while WARG is a volume statistic. No, statistics don’t tell the whole story and even these ones don’t measure effectiveness. Yes, any player rating system is going to have a certain level of arbitrariness to it because the system designer has to make decisions about what they consider important and unimportant. I’m fully aware of these things and wrote 1500 words accordingly at the end of the PPG primer.
A thing I’m trying to do this season is publish all of my rating systems on Google Sheets so anyone can have a look. You can see match-by-match ratings for NRL and the two State Cups if that’s your jam.
