

Over the last month, we’ve been looking at rating players using a metric called Production Per Game, or PPG. We’ve used it to find players at the higher end, justifying million dollar salaries, and at the lower end, identifying fringe first graders.
The tricky thing about rating players is determining what information from the past can be used to project the player’s performance into the future. I hope it’s obvious why this might be interesting.
Within a player’s career, there is a noticeable amount of variation from season to season. On average, players get two pips (one pip is .001 of a PPG rating) worse, although the actual range is lies between improving by 96 pips or losing 86 somewhere (standard deviation of 24 pips) from season to season.
That’s a fairly dramatic range of change in production. Let’s drill into some of the potential causes to see if we can’t model these changes.
But before that, this post in particular, but also most work I’ve done, owes a debt of gratitude to the Rugby League Project. They do good and important work recording rugby league’s history and you should sling them a few bucks.
Age
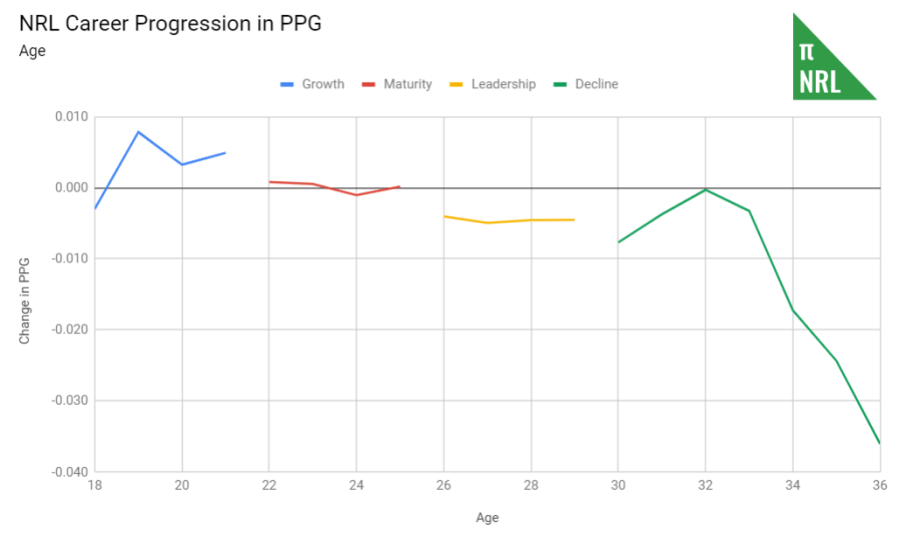
A small portion of seasonal variation can be attributed to age. I took the average change in PPG for each age cohort across the league (2013 to 2018, minimum five games played) and we see four distinct phases:
- growth and improvement from age 18 to 21, where PPG goes up year on year
- maturing into a consistent role from 22 to 25, where PPG is stable from year to year
- moving into a leadership role, where the player typically does less work, from 25 to 30, where PPG falls 5 pips each year
- finally the decline from age 30 onwards, losing 10 pips a year on average
This is very broad brush, hiding some of the underlying realities. Most of the players that make it to their thirties are the elite and that masks the overall decline somewhat. Even among younger players, of the 25 year olds running around in 2020, over half of them will be gone from the league by 2025 and two-thirds by 2026. Their declines are not visible in the dataset, even though it probably would continue at an accelerated pace if they were able to maintain a place in the league.
What you’re seeing is the effect of age on the better end of the athlete spectrum and so the effect is potentially muted. Consequently, the effects derived are small and likely underestimated but worth accounting for.
Experience
Given the comparatively few examples at both ends of the age spectrum, I wondered if there might be a larger effect shown by comparing players as they gain experience. Everyone is a rookie at some point, which could help fill out the sample size.
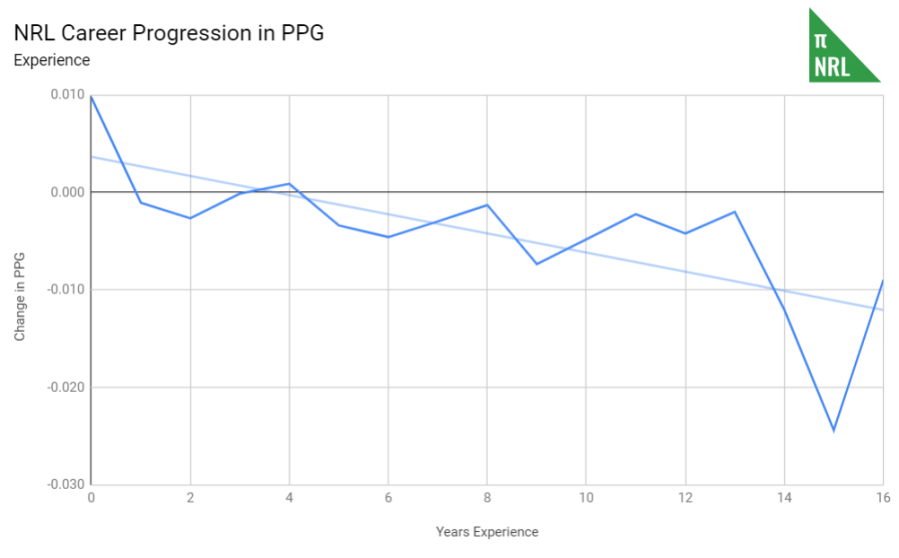
I don’t have a solid explanation for why experience correlates to a loss of PPG over time. I suspect that for the bulk of professional rugby league players, your future is decided in the first two or three years of your career. Those that progress are the ones who make outsized impacts in that initial phase. As we’ll see, that impact is generally not sustainable. There’s also an obvious correlation between age and experience that will have overlapping explanations.
However, for elite players who have long careers, their levels are high enough that the decline is not noticeable or their roles change, so their reduced production is less important. In either case, that loss for the team can be offset by the introduction of new young players, keen to get involved and make a statement that will potentially define their careers. Again, this effect is small but worth accounting for.
Reversion to Mean
Like many sports analytics, there’s a substantial reversion to mean effect at work from season to season in PPG.
By definition, a player who produces as much as the average player in that position and plays the average number of minutes will be rated .100. The way the league actually pans out, the average player has a PPG of .090. If you’re better or worse than the mean in one period, you’re likely to come back to the pack in the next.
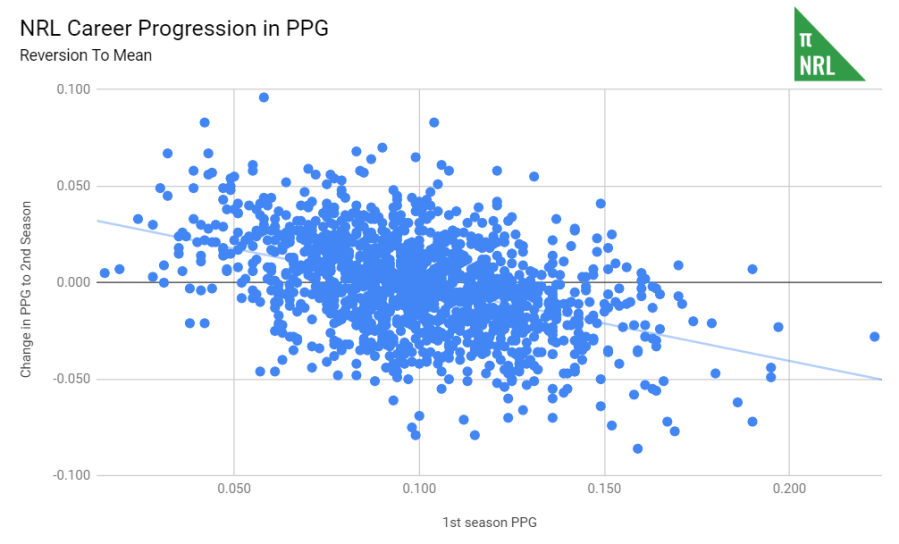
Not only do players generally tend in the direction of the mean but the further away from the mean, the stronger the correction. The correlation is weak-to-moderate, partly because some players refuse to get better – their careers are typically short-lived – and there are stars who defy the pull of gravity. That’s largely what makes them stars. However, this does provide a useful linear relationship for projecting future performances.
Projecting
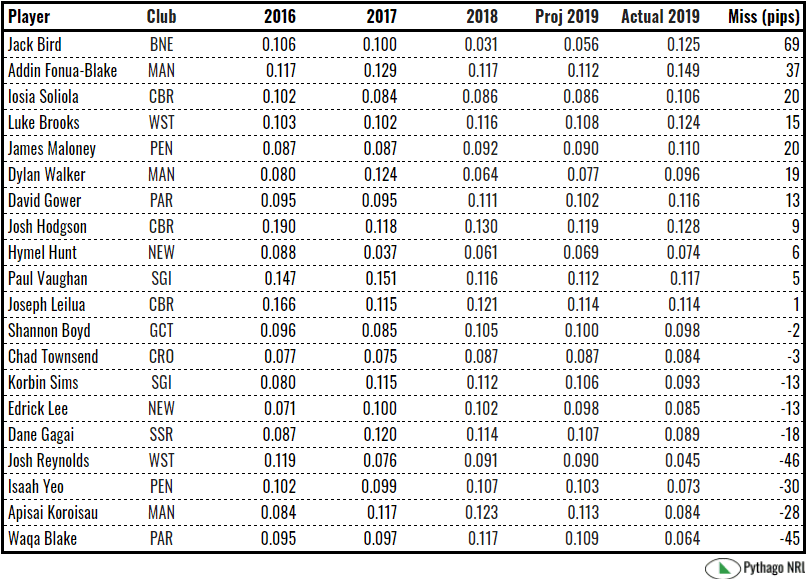
Let’s take these factors and apply some linear weights to establish their relative importance (reversion to mean > age or experience). A weighted average of the past three years of experience, with the most recent more heavily weighted, provides a solid base from which to work. Using more information did not materially improve the projection error in the training data and using less was substantially less accurate.
Applied to the 2019 season to round 23, the projection for players with three seasons of data misses by an average of 16 pips. For rookies, with no prior data and we assume a PPG of .088, the projection misses by 28 pips. The error varies proportional to the amount and recency of the data available on the player.
There are 200-odd players that have three years of past experience. I won’t list all of them but here’s a random selection of players as a demonstration.
And the totals for each team:
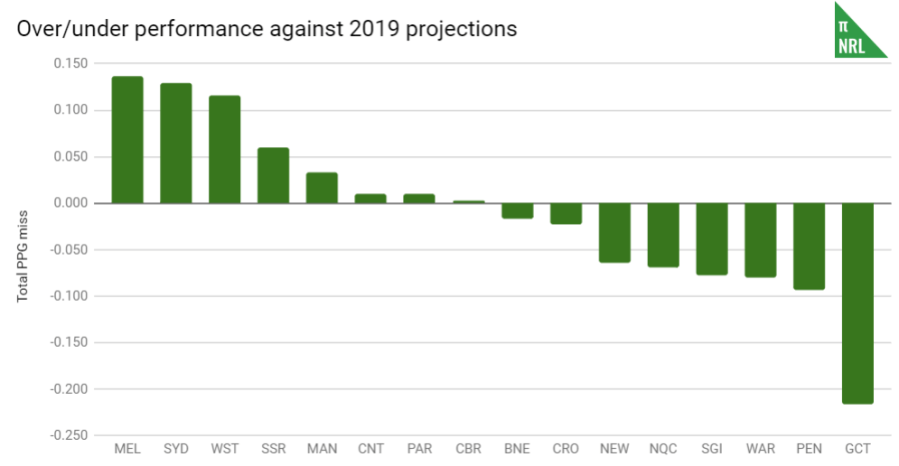
No surprises to see good teams outperforming their projections and bad ones underperforming, especially the Titans who have put a paltry effort into 2019. It is interesting to see the Wests Tigers well up there. This neatly fits the narrative that Michael Maguire’s coaching has gotten a very average list into finals contention.
The next step is using this to assess the value of the player’s contribution to the roster for the next season. Using the techniques developed previously, here’s an attempt at putting a dollar value ($500k/WARG + $105k) on the players we projected PPG for and what they actually produced. Note the projected and calculated Wins Above Reserve Grade (WARG) is based on the player sustaining their PPG for twenty-four games, which is not a particularly good assumption, but does mean we are comparing like for like.
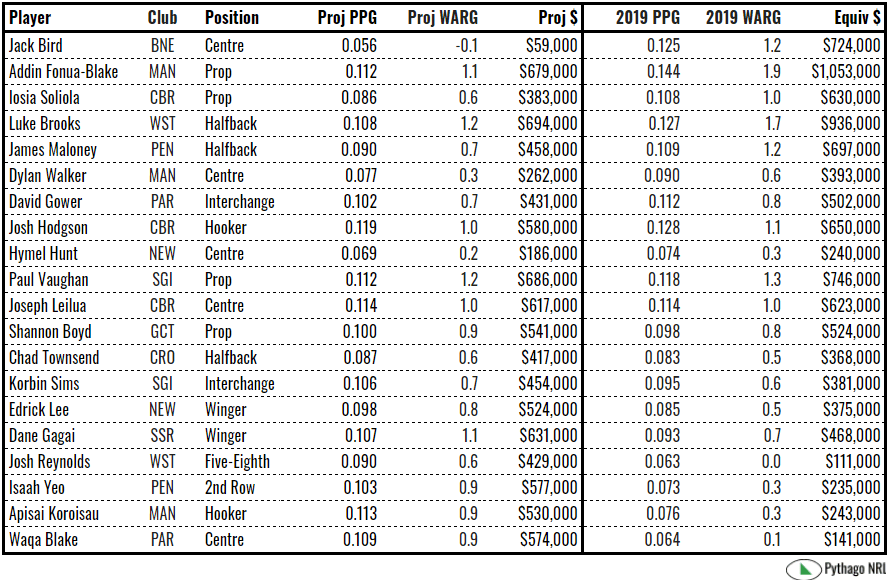
Their positional classification is also important, especially if a player can or does rotate between, for example, centre and wing or wing and fullback. You could potentially get around this by projecting production based on an average of 60% centre play and 40% wing, adjusting percentages as suits the players and likelihood of roles changing.
The projection inaccuracies would have a fairly substantial financial impact on the players. Lucky for the players, this is not how their salaries are decided. It does goes to show just how difficult this task is, particularly at the top and bottom ends of the league. When clubs get excited and pay “overs”, we should recognise that not every team sets the same price for wins and there are no crystal balls in rugby league.
