WCL is a means of estimating the probability of a team winning a rugby league match at a given point in the game.
The WCL system finds all instances of a given margin at a given point in the game in that league and calculates how often a team in that position won the game. For example, if 60% of teams who had a 6 point lead after 24 minutes, then we take that to mean that a team who has a 6 point lead after 24 minutes has a 60% chance of winning the game. From this we can build up in-game win probability charts, not unlike those you might have seen on Five Thirty Eight or similar.
It’s that simple. I have used some averaging to smooth out rough edges in the dataset (especially for odd-numbered margins) and where there are too few games in the sample that the model’s results do not make sense, I have edited some of these manually. For example, a one point lead from half time through 60 minutes into the game should not have a less than 50% win probability for the leading team but it apparently does in the NRL.
Note that 100% is only achieved at full time; the remainder of the game is never more than 99.9%. Even though this is not visible, it reflects the reality that our dataset does not cover all available possibilities.
While I could build a more sophisticated model that includes all sorts of other elements, I wanted a basic means to gauge the in-game win probability based on the scoreboard. I do not care what the pre-game odds are and I do not care about the “momentum” or other states of the game. The model is blind to the teams playing and is entirely dependent on the margin and time on clock.
WCL has no overall predictive power but it can graphically summarise a game quite well with a layer of information that simply plotting the margin does not. The sum of team’s win probability percentages at each minute of the game gives a WCL score, which is indicative of how dominant the team has been. A tight game will have each team’s score close to zero, while a perfectly dominant game will have the winning team’s score close to 50 and the loser’s close to -50.
There are separate WCL datasets for NRL, NSW Cup and Qld Cup, based on all matches from 2016 to date. There’s also a generalised men’s WCL set, which is the combination of all three that should be suitable for representative games that would otherwise have too small a sample size to work with or Super League should the need arise. I have been collecting NRLW and QRLW event data as well but there are too few games to form a proper dataset.
WCL stands for Worm Chess Lathe. Worm because the graphs resemble the worm from Australian TV political debates, which are meant to reflect audience responses live in real time. Chess and Lathe because the graphs sometimes resemble a chess piece in profile (bishops and queens, generally), as if it had been created with a wood lathe. The system needed a name and WCL is as good as any.
Generally speaking, this is for novelty purposes but it can also help us answer questions like the following –
Was Magic Round ruined by bins and send offs?
While we all enjoy the chaos of bins and send offs during live football, the fun does wear off somewhat after eight in two games, so yes. But were the game outcomes materially changed by the bins and send offs?

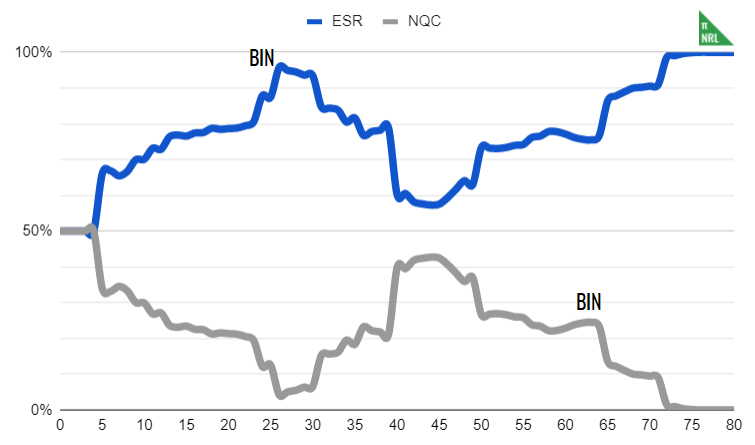
Ah! Well, nevertheless…
Some selected games of interest
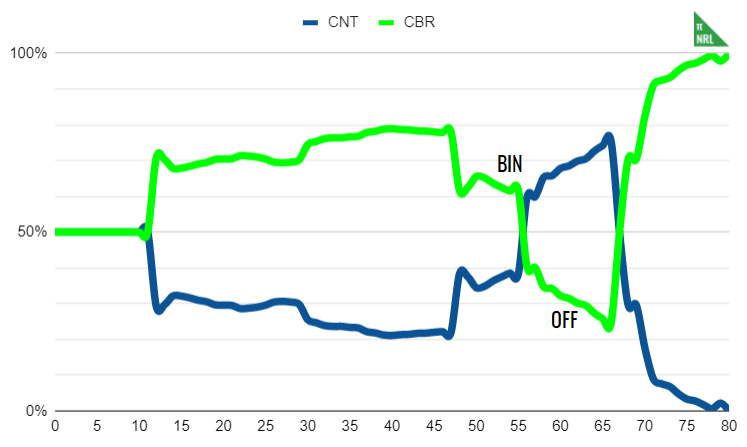
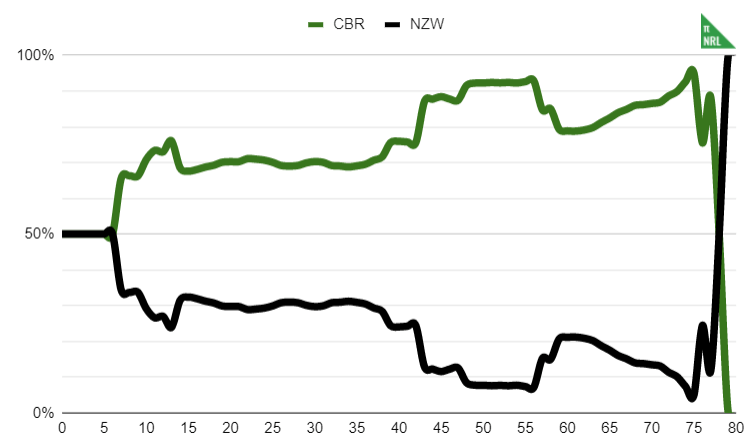
Panthers vs Raiders, round 14, 2017

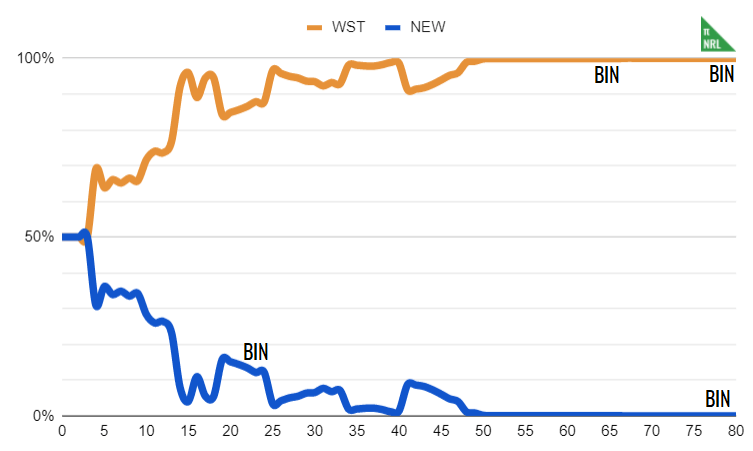
Raiders vs Warriors, round 3, 2018
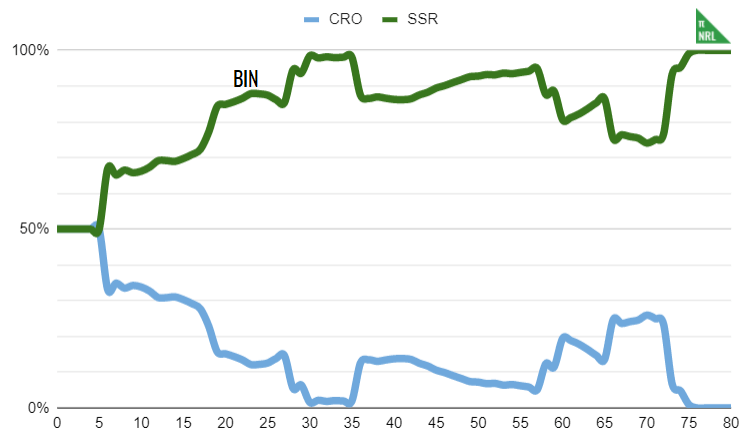
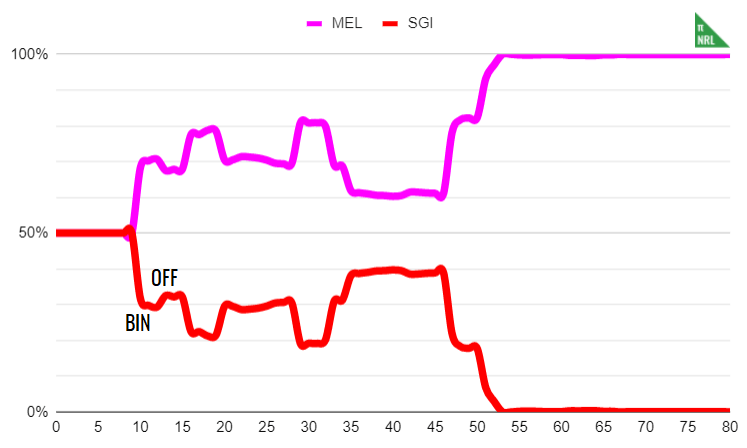
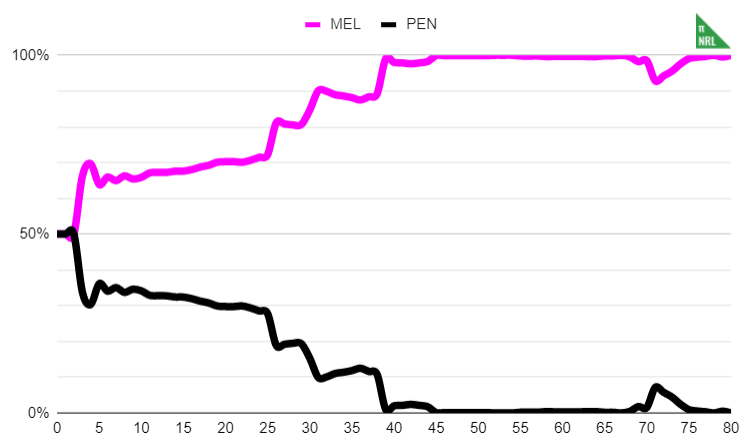
Storm vs Panthers, grand final, 2020
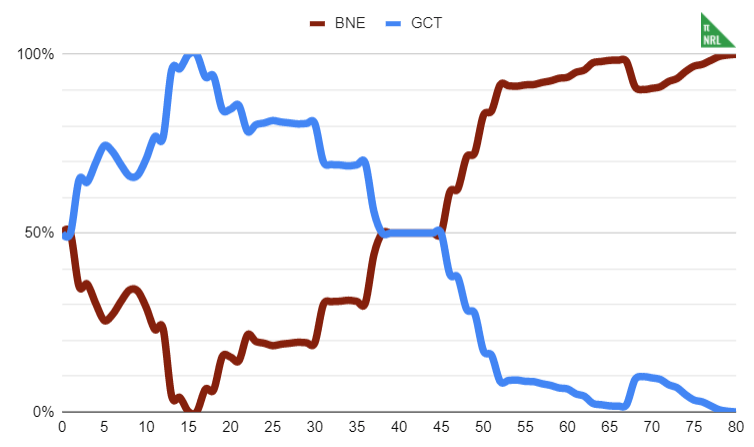
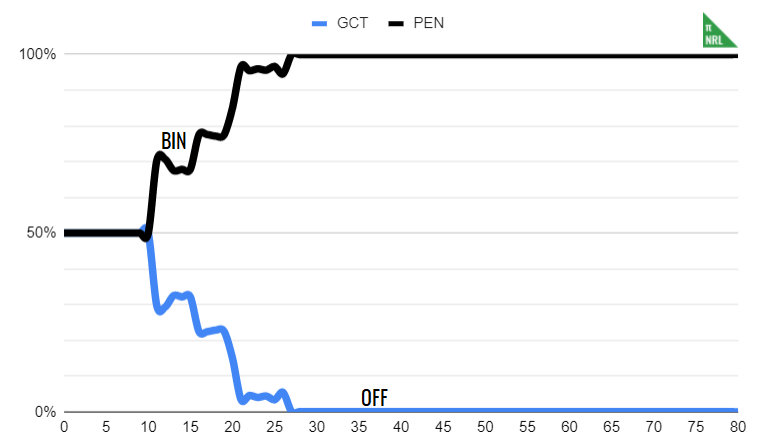
Broncos vs Titans, round 8, 2021