We’re just a bit over half way into the 2021 NRL season and it’s time to review how each team and player are performing. We’ll be looking at this using the following analytical tools:
- Form – Elo ratings that reflect short term performance.
- Production – The accumulation of valuable work on field, as measured by statistics that correlate with winning. Production is measured in Taylors.
- Disappointment Line – The minimum number of wins for the season to not be considered disappointing by fans, as calculated by the pre-season class (long term performance) Elo rating.
- 1st order wins – Pythagorean expectation calculated by points for and against.
- 2nd order wins – Pythagorean expectation calculated by SCWP.
There’s more detail at How It All Works.
Unlike the season preview deep dive, I won’t be providing much analysis for individual teams or players, instead preferring to let you do the work for your favourite team or player with the context about how the tools work provided.

WIP graphs
Comparing win percentage of the Disappointment Line, pre-season projected wins, actual wins (0th), Pythagorean wins (1st) and 2nd order wins.
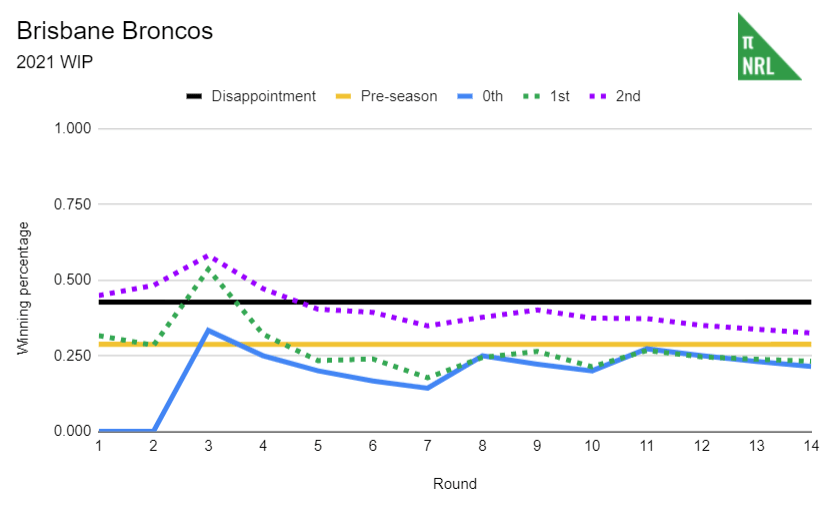

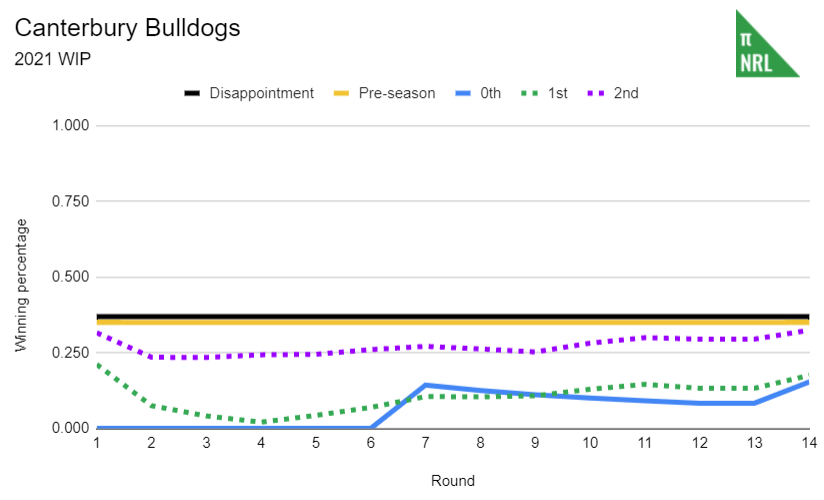
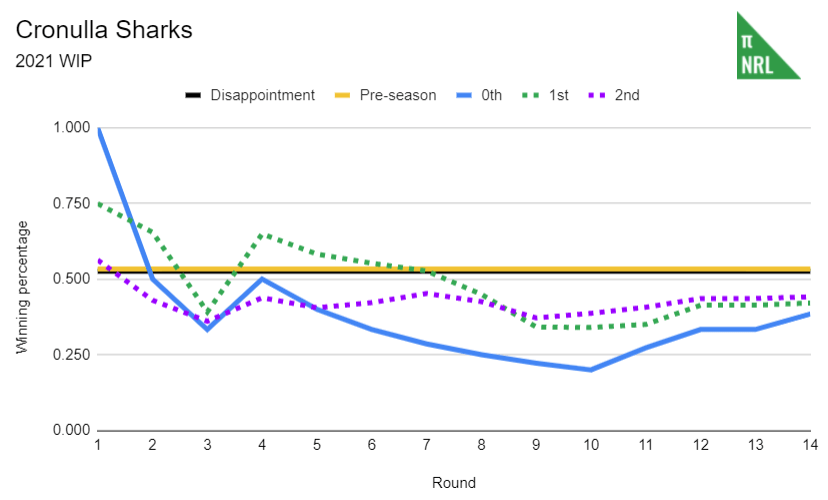
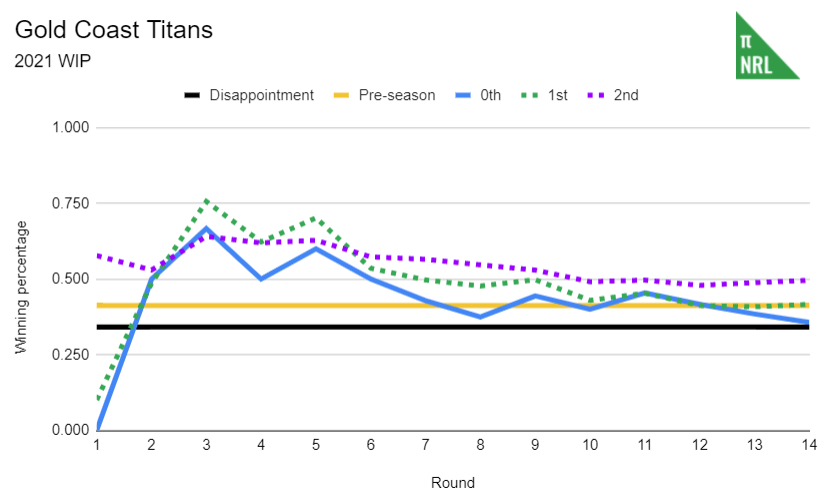
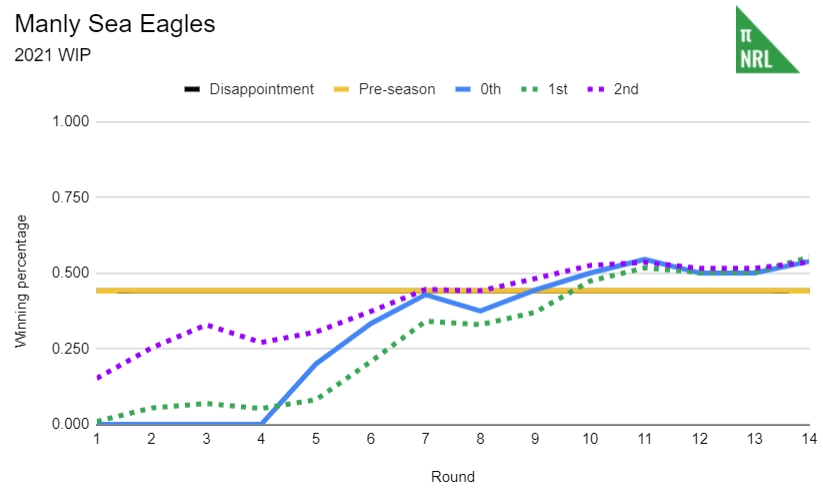


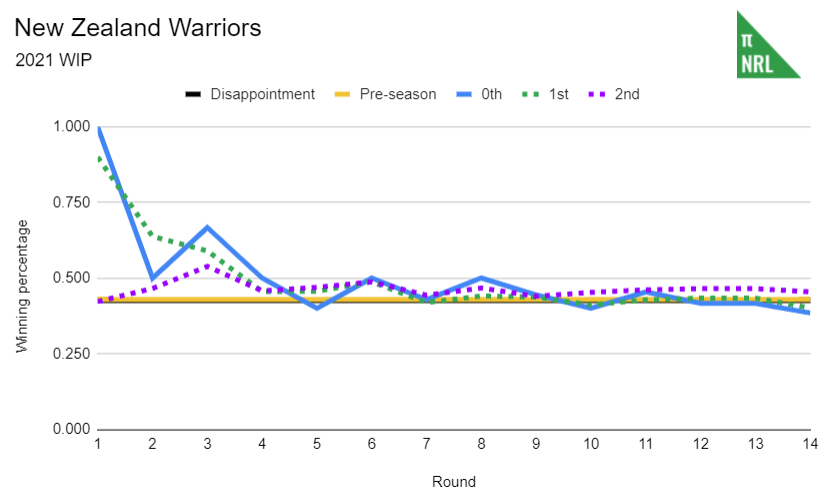


To be perfectly honest, I’m not 100% sure what these are meant to look like, having been the first time I’ve presented this information in this format. For example, I’m surprised that the pre-season projections and Disappointment Line are often pretty much the same because I’d never thought to check previously. Note that the zero to one scale for winning percentage can make significant differences look minor; a .100 change in winning percentage is worth 2.4 wins at season’s end.
The projections are naturally more conservative (less likely to predict outliers) to cover the potential spread of results. Think of, for example, Penrith as having 15.6 projected wins plus/minus 3 wins. While some projections are right, it tends to overshoot really bad teams and undershoot really good teams.
Significant divergences between actual and Pythagorean wins are usually indicative of mean regression in future. That is, teams underperforming will improve their actual win percentage and vice versa so that the two numbers tend to converge. However, there’s always one or two that manage to avoid this convergence. We call them lucky/unlucky, depending on the direction that they miss.
The current status of each team:
- Way out – Cowboys, Rabbitohs
- Actual wins understating year to date performance / potentially tending better – Titans, Panthers, Dragons,
- Actual wins overstating year to date performance / potentially tending worse – Knights
- Actual wins reflective of year to date performance – Broncos, Raiders, Bulldogs, Sharks, Sea Eagles, Storm, Warriors, Eels, Rosoters, Tigers
For teams with less than .500 percentage, 2nd order wins is always better than actual wins and vice versa. The trick here is to not focus on this specific value per se but to look at it as a prediction for next year’s performance. The next season’s performance for most teams will fall within one standard deviation (plus/minus .130) of their 2nd order win percentage for this season.
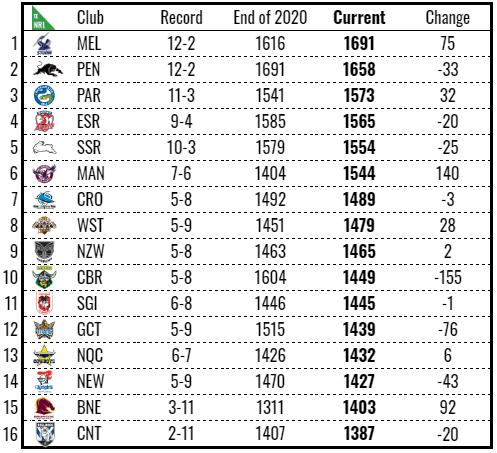
Form
Form Elo ratings at the end of 2020 and the end of round 14
Production
Pre-season projected and average year-to-date Taylors per game

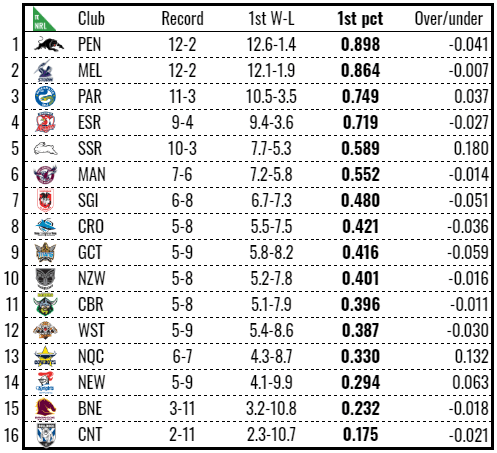
1st Order Wins
Winning percentage estimated by Pythagorean expectation of actual points for and against
2nd Order Wins
Winning percentage estimated by Pythagorean expectation of SCWP for and against

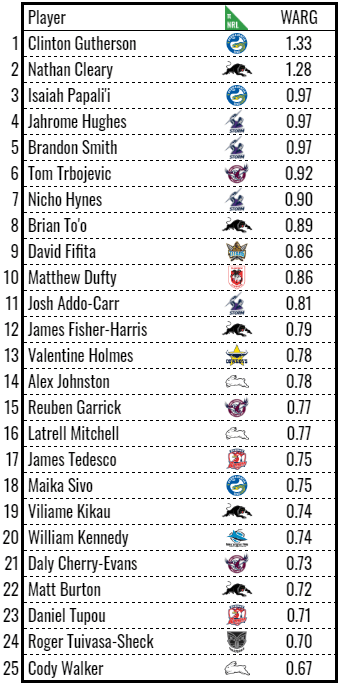
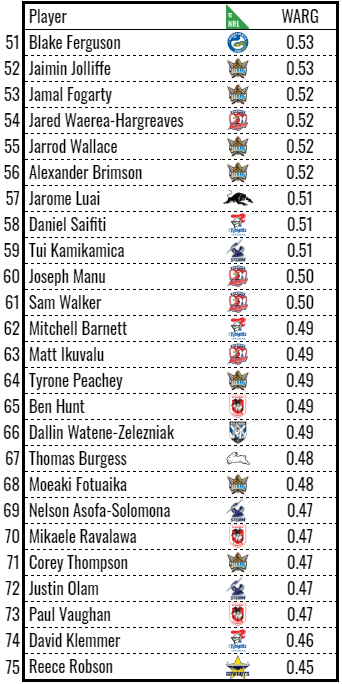
Player Leaderboards
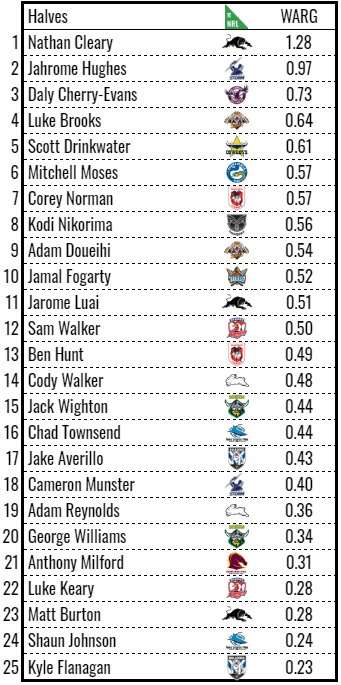
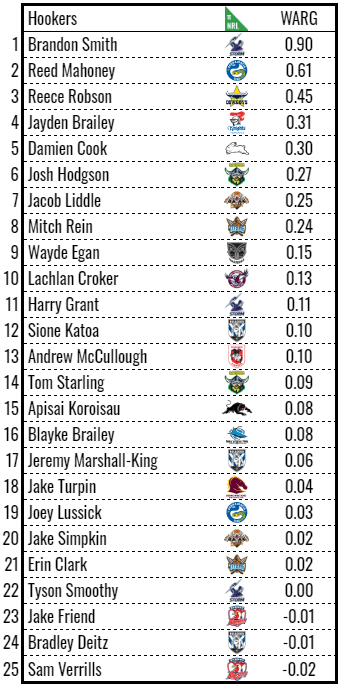
Wins Above Reserve Grade
WARG is a volume stat that compares the total amount of valuable work done (production), when compared to a replacement level player (or fringe first grader in the vernacular) at that position, irrespective of the time on field. A replacement level player has 0 WARG.
2020 was topped by Daly Cherry-Evans with 2.1 WARG. The career leader (2013 – now) is James Tedesco with 11.3 WARG. The single season record holder is Jarryd Hayne in 2014 with 2.3 WARG.


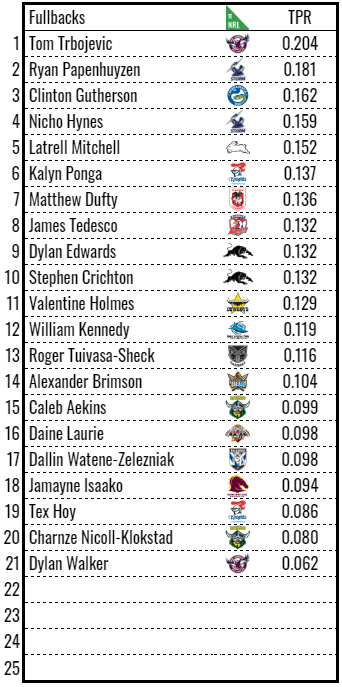
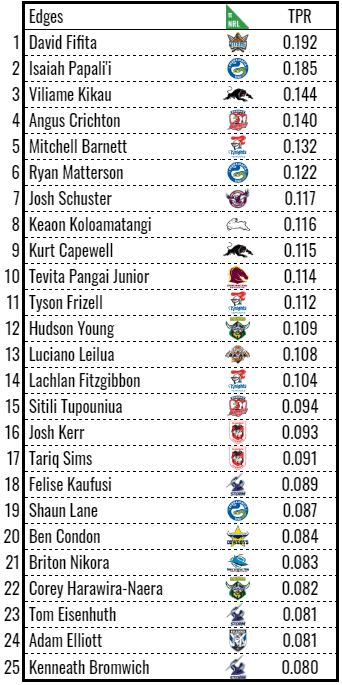
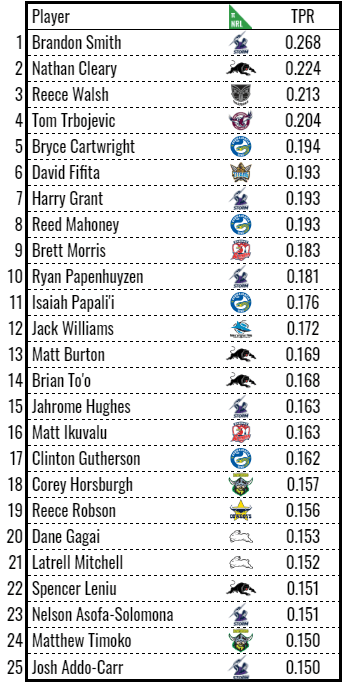
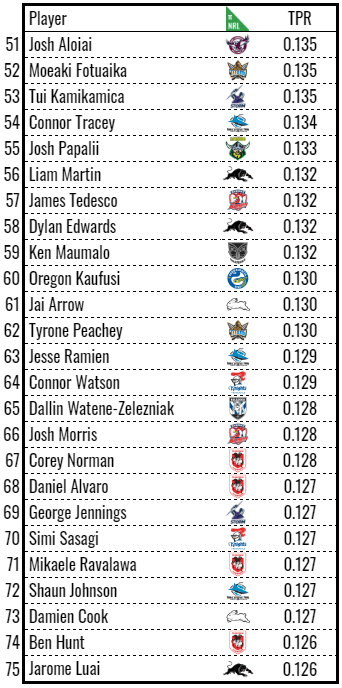
Taylor Player Rating
TPR is a rate stat that compares the amount of valuable work done (production) per game, factoring in time on field, to the average player at that position. An average player has a rating of .100. Minimum 5 games need to be played to qualify for TPR.
The 2020 regular season was topped by Cameron Smith with a TPR of .229. The career (2013 – now, regular season only, minimum 10 games) leaders are Harry Grant and Robbie Farah with a TPR of .164. The single regular season record holder is Robbie Farah with a TPR of .244 in 2013.


2021 WARG by position
WARG as generated when the player is listed in that position so far this season.


2021 TPR by position
TPR as generated when the player is listed in that position so far this season (minimum five games).