We’re about a third of the way through the Super League season (maybe? Depending on covid and weather, I suppose) and it’s time to review how each team and player are performing. We’ll be looking at this using the following analytical tools:
- Form – Elo ratings that reflect short term performance.
- Production – The accumulation of valuable work on field, as measured by statistics that correlate with winning. Production is measured in Rismans.
- Disappointment Line – The minimum number of wins for the season to not be considered disappointing by fans, as calculated by the pre-season class (long term performance) Elo rating.
- 1st order wins – Pythagorean expectation calculated by points for and against.
- 2nd order wins – Pythagorean expectation calculated by SCWP.
There’s more detail at How It All Works.
I won’t be providing much analysis for individual teams or players, instead preferring to let you do the work for your favourite team or player with the context about how the tools work provided.

WIP graphs
Comparing win percentage of the Disappointment Line, actual wins (0th), Pythagorean wins (1st) and 2nd order wins.
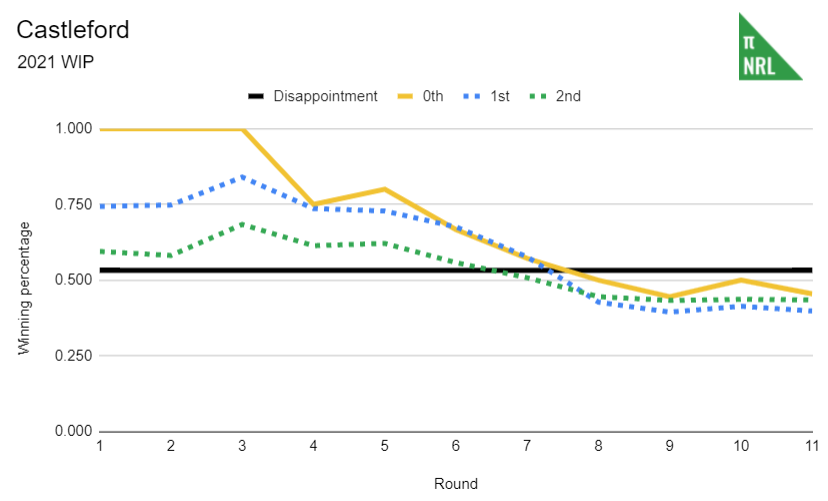
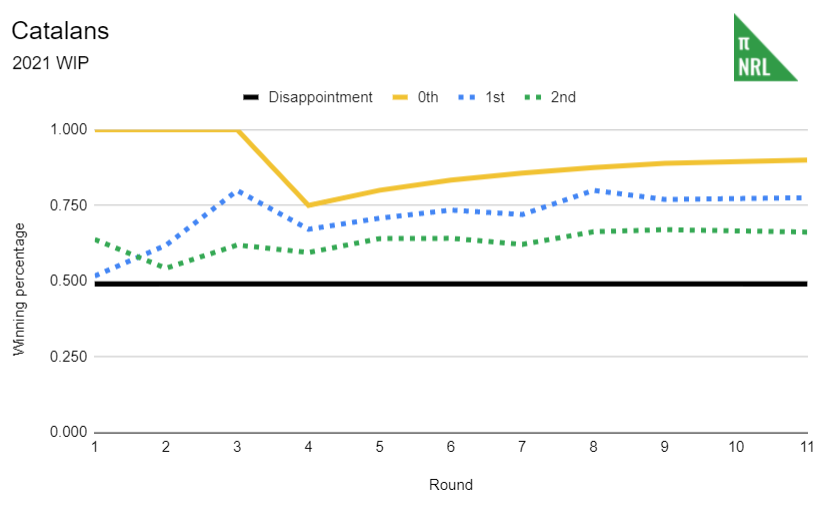
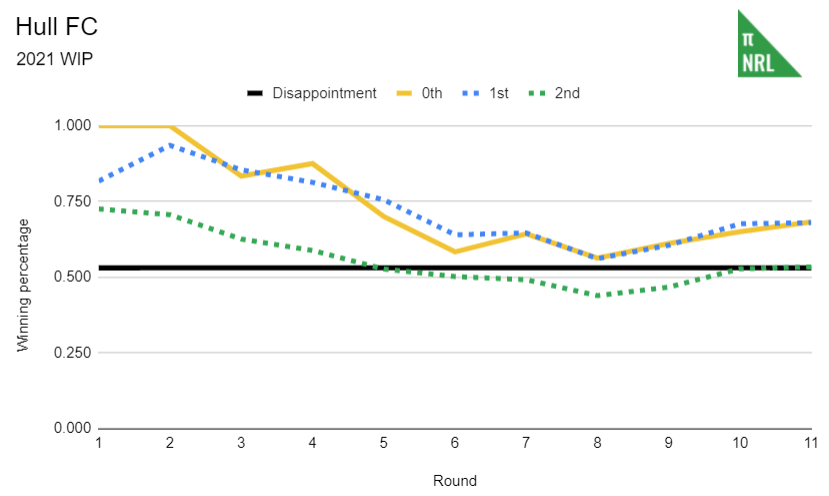
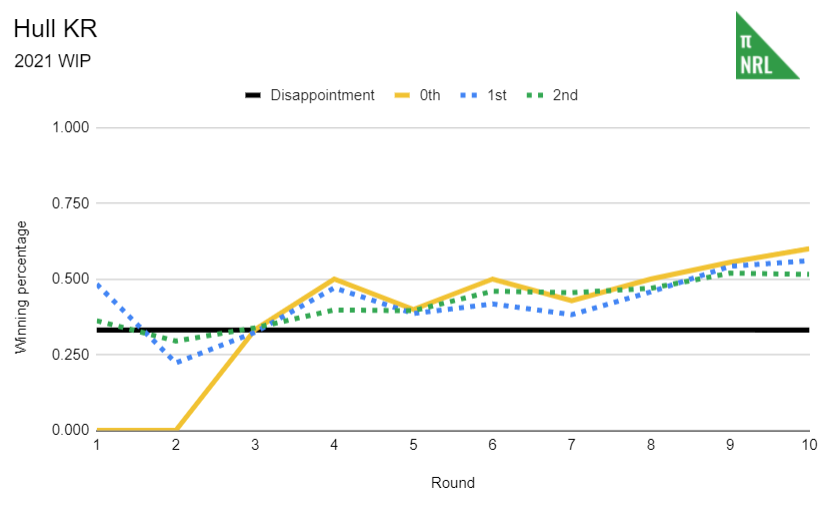
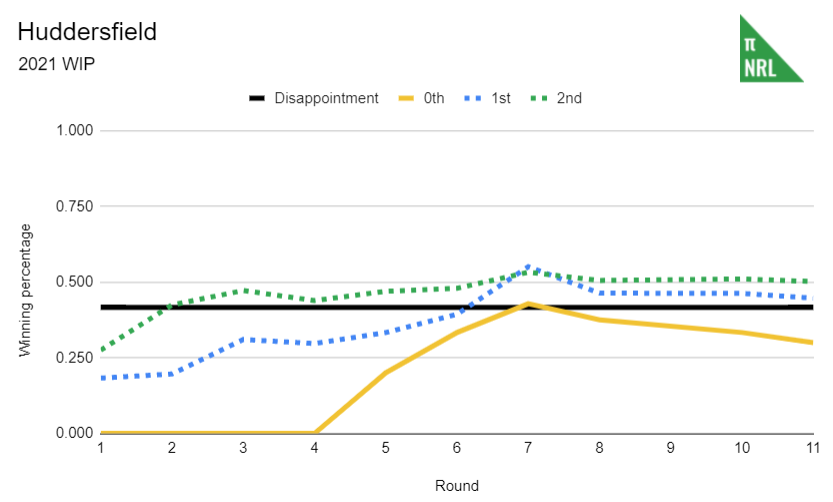
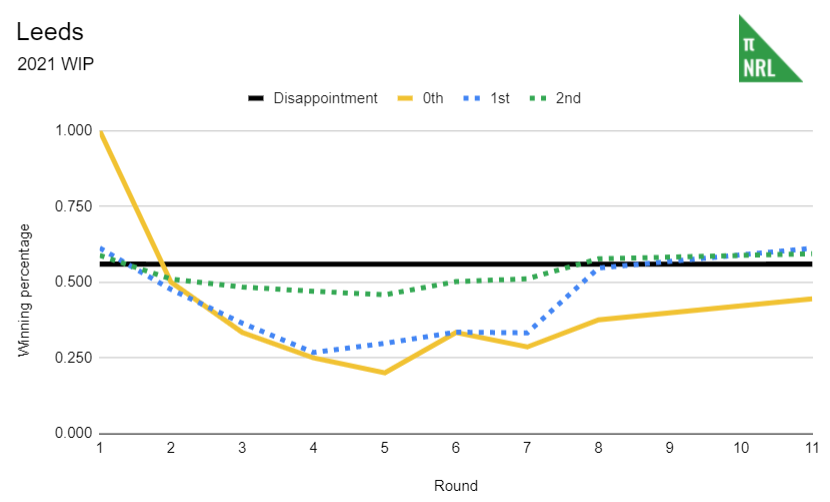
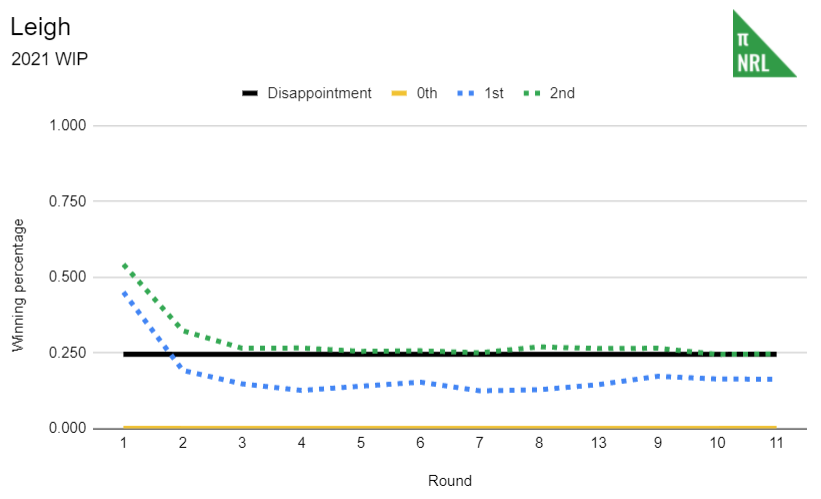
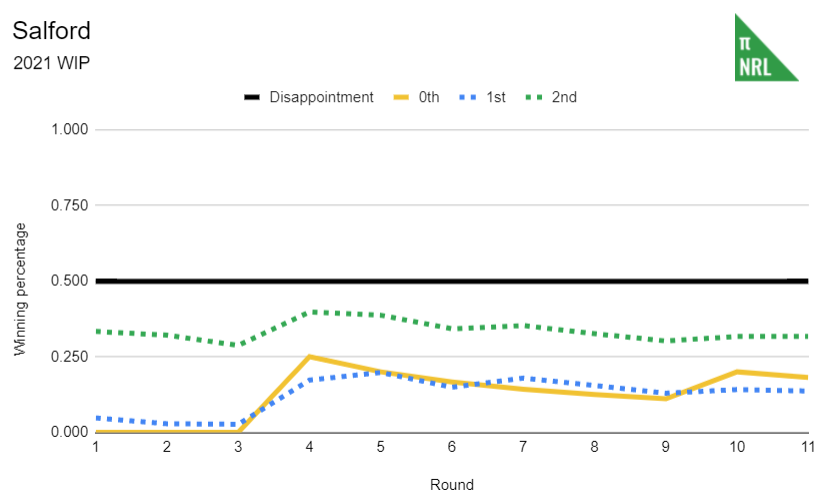
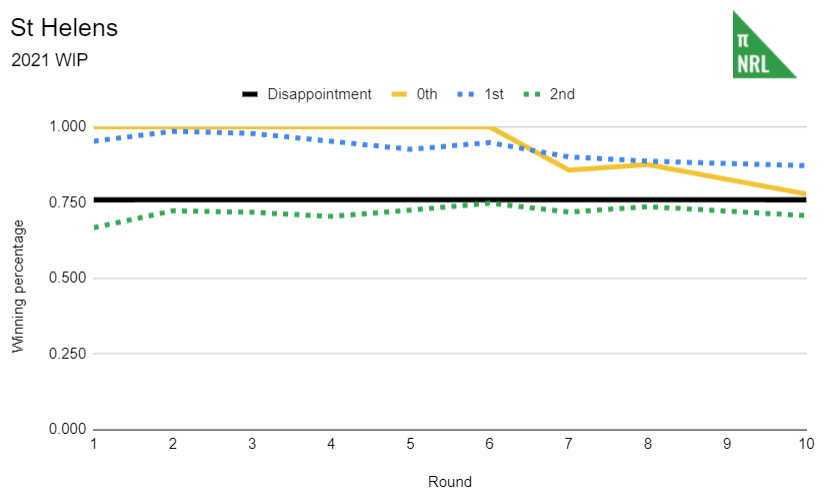
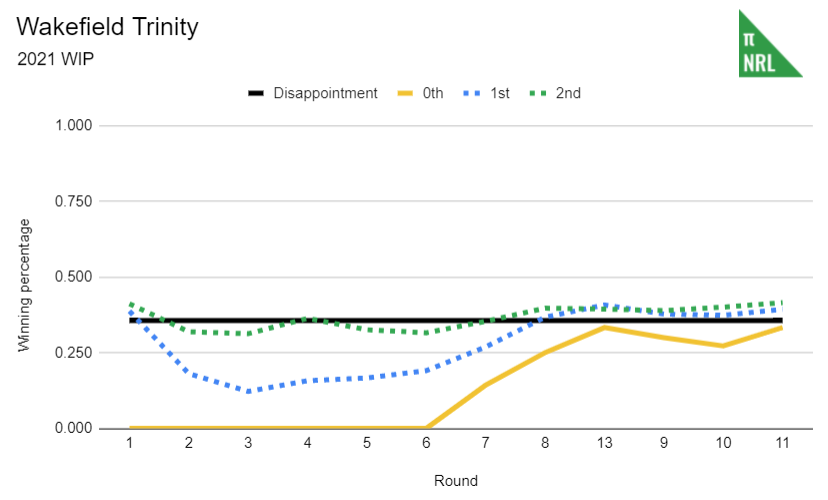
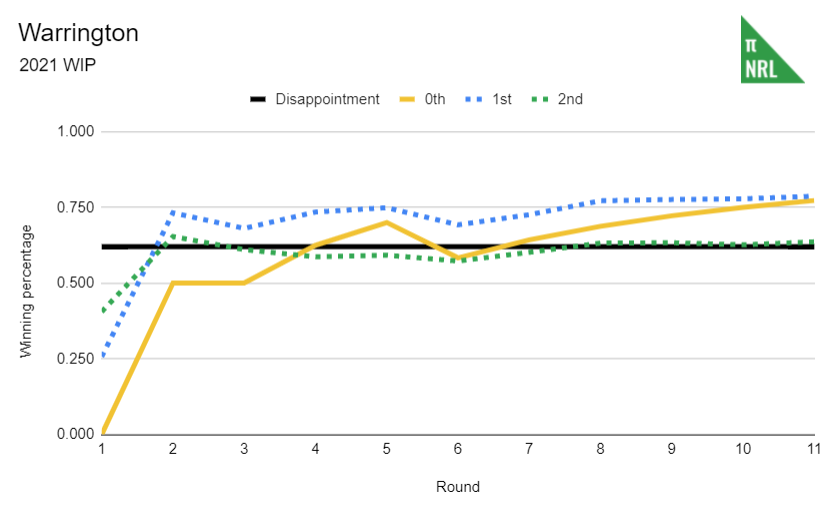
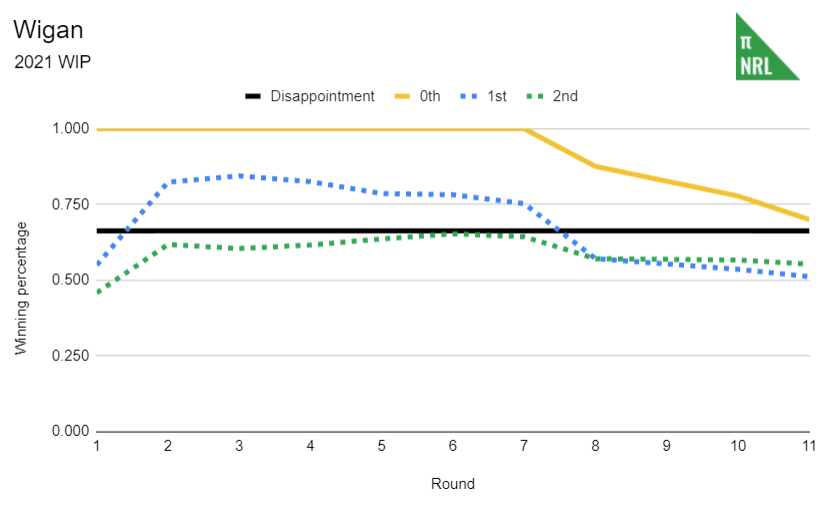
Note that the zero to one scale for winning percentage can make significant differences look minor; a .100 change in winning percentage is worth up to 2.5 wins at season’s end.
Some of the games have no or incomplete stats, so the second order stats might not move in line with the first order or winning percentage. Some teams haven’t played all of their games between round 1 and 11, in which case the lines do not change through this round. Statistics do not include Castleford’s forefit to St Helens.
Significant divergences between actual and Pythagorean wins are usually indicative of mean regression in future. That is, teams underperforming will improve their actual win percentage and vice versa so that the two numbers tend to converge. However, there’s always one or two that manage to avoid this convergence. We call them lucky/unlucky, depending on the direction that they miss and the ladder is currently a mess.
The outlook for each team:
- Actual wins understating year to date performance / potentially tending better – St Helens, Leeds, Huddersfield, Leigh
- Actual wins overstating year to date performance / potentially tending worse – Catalans, Wigan
- Actual wins reflective of year to date performance – Warrington, Hull FC, Hull KR, Castleford, Wakefield Trinity, Salford
For teams with less than .500 percentage, 2nd order wins is always better than actual wins and vice versa. The trick here is to not focus on this specific value per se but to look at it as a prediction for next year’s performance. The next season’s performance for most teams will fall within one standard deviation (plus/minus .130) of their 2nd order win percentage for this season.
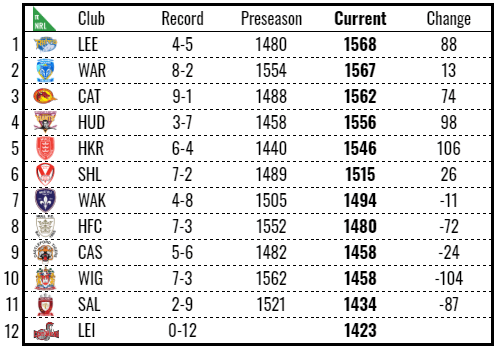
Form
Form Elo ratings at the end of 2020 and the end of round 11
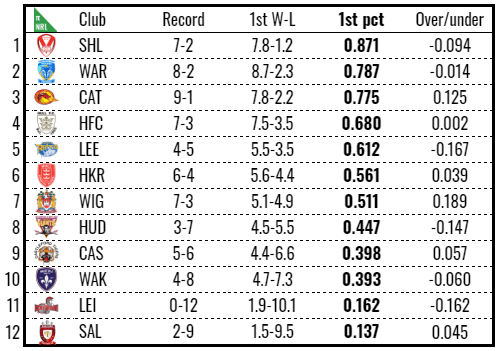
1st Order Wins
Winning percentage estimated by Pythagorean expectation of actual points for and against
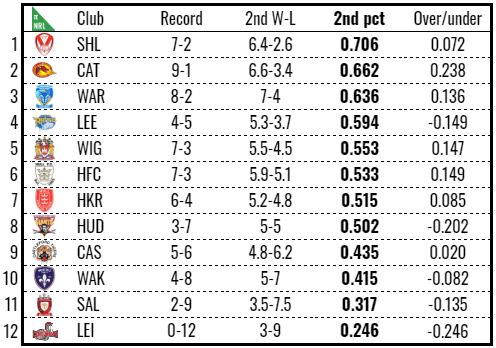
2nd Order Wins
Winning percentage estimated by Pythagorean expectation of SCWP for and against
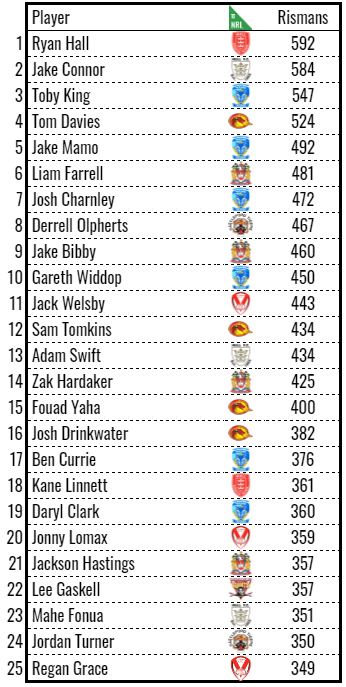
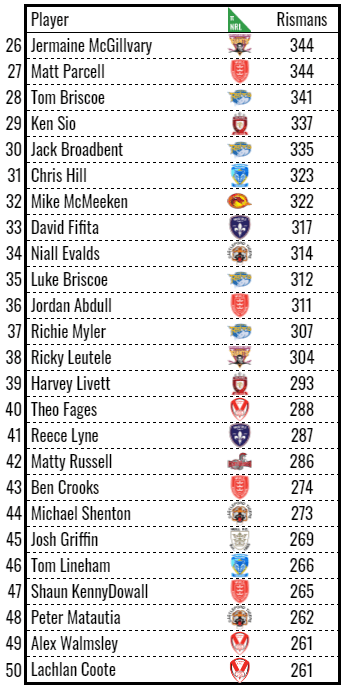
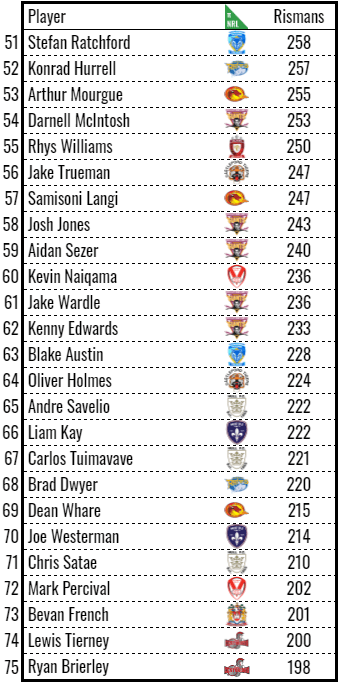
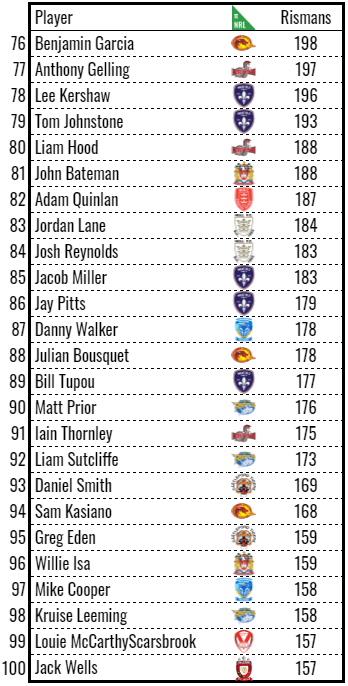
Player Leaderboards
Rismans
Rismans are the unit of measure for the amount of valuable work done (production), equivalent to Taylors in Australia. Due to the state of the dataset, not all games and appearances will have been captured.
The career leader (2017 – now) for total Rismans is Jermaine McGillvary with 4402. The single season record holder is Jackson Hastings in 2019 with 1768. 2020 was topped by Bevan French with 1114.
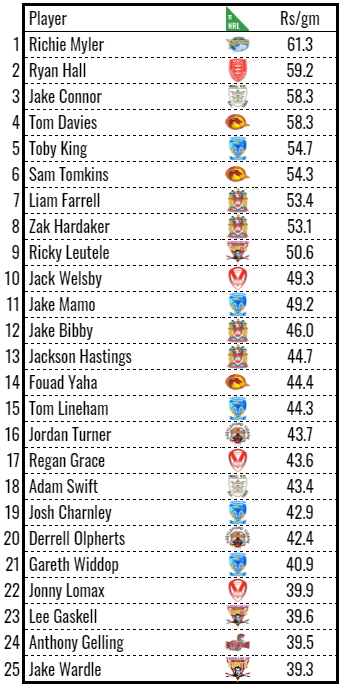
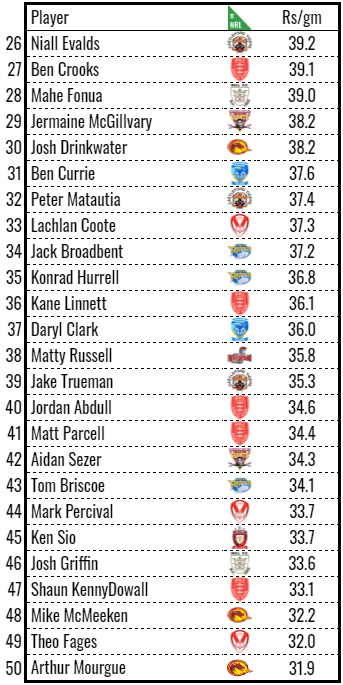
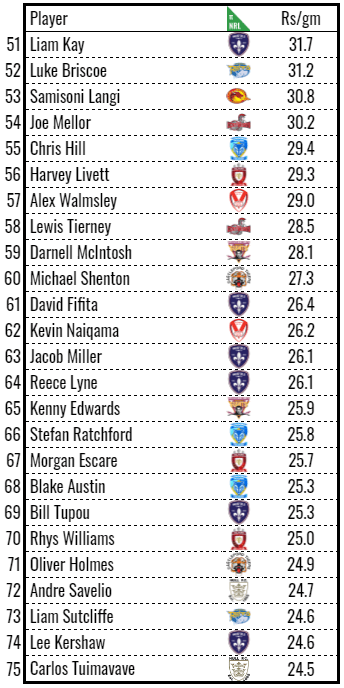
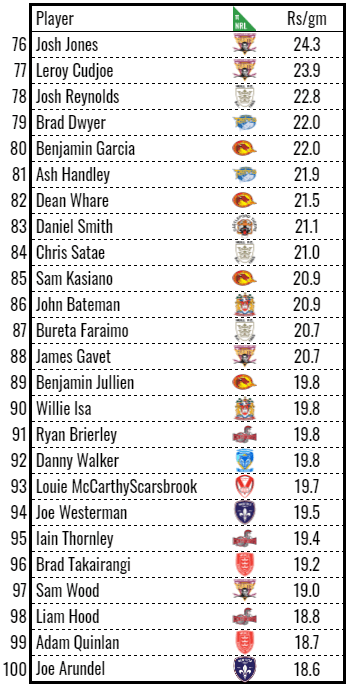
Rismans per game
As above but averaged per game (minimum 5 games)
The career leader (2017 – now) for Rismans per game is Peta Hiku with 74.1 (minimum 10 games). The single season record holder is (minimum 5 games) Craig Hall in 2018 with 76.7. 2020 was topped by Ash Handley with 68.0.