

Poseidon ratings are a new team rating system for both the NRL and the Queensland Cup.
For those who don’t have time to read 2000+ words, here’s the short version: the purpose of Poseidon ratings is to assess the offensive and defensive capabilities of rugby league teams in terms of the number of tries they score and concede against the league average. By using these ratings, we can estimate how many tries will be scored/conceded in specific match ups and then use that, with probability distributions, to calculate an expected score, margin and winning probabilities for the match-up.

Poisson
Siméon Denis Poisson was a French dude who did statistics. He came up with a distribution – that is, a function you can use to calculate the probability of an event, given certain input variables – which bears his name in 1837. He also did a lot of other stuff named after him which I do not pretend to understand.
A Poisson distributed variable has the following characteristics:
- The variable you’re trying to find the probability of is discrete or a thing that can be counted in whole numbers. Examples include number of people getting in a queue (you can’t have half a person), goals scored (you can’t score half a goal), etc.
- The variable occurs at a known, constant rate within a fixed period of time. On average, 100 people per hour might get in a queue or a team might score 1.5 goals per 90 minute game of soccer on average.
Even though your rate is constant over the long run, in the short run, the outcomes can vary greatly. If Liverpool average 2.5 goals per game over a season, they might have games where they score only one goal or five goals. What are the odds that they will do score a particular number of goals? A Poisson distribution will tell you if you know the rate at which goals are scored.
It turns out a lot of events in a game of rugby league approximately follow a Poisson distribution. For example, on average, each NRL team scored 3.5 tries per game from 2013 to 2018. In that time, some teams scored zero tries and some scored more than eight.
Based on that, we can plot a Poisson distribution to show the probability of k number of tries being scored, given a mean rate (λ) of 3.51 per game. This is how the Poisson prediction stacks up against the actual rate of tries being scored:
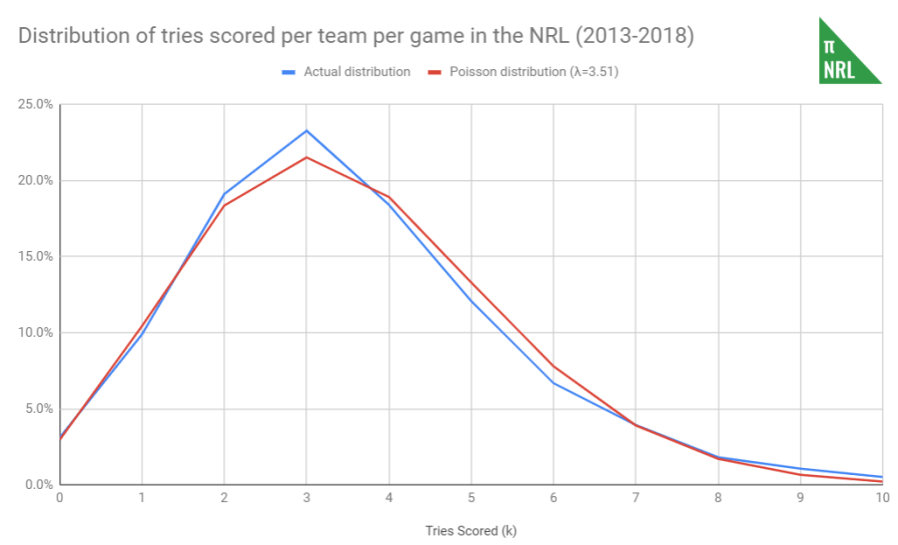
It’s very close and certainly close enough for our purposes. For example, two tries are scored by a team in 19.1% of games and Poisson, based on λ=3.51, k=2, predicts two tries being scored in 18.4% of games.
Here’s an abbreviated list of things that seem to follow a Poisson distribution:
- Tries scored per game
- Errors per game
- Line breaks per game
- Penalties conceded per game (yes, #refsfault is actually a discrete random variable)
Here’s a couple of things that don’t follow a Poisson distribution:
- Running metres per game (follows a normal(ish) distribution)
- Conversions (follows a binomial distribution)
A match could be described by a bunch of Poisson and other kinds of distributions overlaid upon each other.
To be clear, that’s obviously not the reality. A person doesn’t get in a queue because of a Poisson distribution. It’s because they need to get to the end of the line for whatever service is being offered there. Similarly, a try doesn’t get scored because of Siméon Denis Poisson. A try is scored because the team works together to create an overlap, allowing a player to break through a gap in the defensive line. However, these real world events occur in such a way that using Poisson distributions are useful to calculating probabilities and approximating match outcomes. It’s a useful tool but we must not fall into the trap of seeing every problem as Poisson-hammerable nails.
xG and xT
Poisson distributions were explained to me at uni as being what you use to calculate the probability of a particular number of people forming a queue or number of letters arriving at an address on a given day. It made zero sense to me at the time. We spent about a lecture on it, I worked out how to answer the question in the exam and moved on.
When I read that goal scoring in soccer follows a Poisson distribution and then reminded myself of what a Poisson distribution is, then it all fell into place. Only a decade later and, truly, what a fantastic endorsement for our higher education system.
The concept of xGoals is one doing the rounds in soccer analytics. The best explanation that I’ve seen is in this thread:
Now we’re not quite at the point of calculating xTries (xT) in the same way as the thread describes the calculation for xGoals (xG). The data exists for rugby league, I’ve seen it and even have some of it, but I haven’t quite got the framework in place (or the time) to have tackled it as yet. That might come in 2020.
What got my attention was charts like these:

Predicting the outcome of a game and its scoreline using Poisson distributions was intriguing. I understood how the table works – you multiply the odds of Brazil scoring x number of goals by Croatia’s odds of scoring y number of goals to fill in each square and then add up the scenarios where Croatia has more goals to determine their likelihood of winning the game – but what we needed was the probability distribution for try scoring in the first place.
Rather than use an elaborate xGoals method described above, I figured we could just take an average of team’s number of tries scored and conceded, at home and away, and use that to create each team’s Poisson distribution.
Poseidon
First thing’s first: why Poseidon? Well, Poisson is French for fish and sounds kind of like Poseidon, Greek god of the sea, and it keeps it with the Greek theming of the system names.
To get a Poseidon rating, we have four sub-component ratings: home attack (BZ), home defence (BΔ), away attack (ϴZ) and away defence (ϴΔ). These are based on, respectively, the number of tries scored per game at home over the previous twelve months, the number of tries conceded per game at home, the number of tries scored away from home per game and the number of tries conceded away from home per game.
Each rating sub-component is the percentage over or under the average. The average being compared to is the league average for tries scored at home per game (which is also the league average for tries conceded away per game) and tries scored away per game (which is also the same as tries conceded at home per game).
If the rating is above average, it is positive, and if it is below average, it is negative. A rating of +25 is 25% better than the average (1.25 times average) and a rating of -19 is 19% worse than the average (0.81 times average). This holds true for offensive and defensive ratings, so unlike the Obstruction Rule, our defensive ratings are higher for better teams, i.e. teams who concede fewer tries than the league average will have a positive rating.
From the sub-components we can build four component ratings for each team: home (B), away (ϴ), offence (Z) and defence (Δ). Home is the sum of the home offence and home defence sub-components. The offence is the sum of home offence and away offence. The away and defence ratings work likewise.
The Poseidon rating (Ψ) is then the sum of home and away or of offence and defence (the numbers come out the same). The rating itself has no particular meaning or units but a good team will obviously have higher ratings for each component and thus have a higher Poseidon rating than bad teams.
These are the ratings for the end of the 2018 regular season (note: finals are not included in Poseidon ratings):


Over the seven seasons of Poseidon ratings we have (5 NRL, 2 QCup), the 2015 Cowboys were the only premiership winner to not have all four components in the positive (home rating was -4). There seem to be four or so teams with all four components positive at the end of each regular season. The grand final loser has had a negative component on two occasions. The 2014 Bulldogs were -22 in attack and the 2017 Cowboys were -6.
We can use these ratings in two different ways to estimate scores, margins and winning probabilities. This has obvious tipping applications and Poseidon will be part of the tipping jury for the 2019 season.
Simple estimate
The simple estimate is used to quickly estimate the expected scores (xSc) for each team and the winning margin. This can be converted to a winning probability the same way we do for form Elo ratings.
Aside: xSc is not going to be the finishing score of the game. Indeed, the xSc usually contains a decimal point and I’m not sure how you score 0.7 of a point in rugby league. It is an average of all the possible scoring combinations, weighted by their probability. This was the basis of the roulette wheel metaphor.
You can actually do an the estimate on the back of an envelope, but it’s a lot easier if you use a computer:
- Take the home/away offence rating, deduct the opposition away/home defence rating, convert back to a percentage and multiply by the league average. This is the expected number of tries (xT) for that team. Multiply this number by 4.
- Take the xT and multiply by the team’s average conversion rate and multiply that by 2.
- Take the team’s number of penalty goals divided by the number of games over the last year and multiply by 2.
- Add these three numbers together.
- Repeat for the other team.
- See which number is bigger. That’s your tip.
Using this method will get you within five or so points of the complex result and a few percentages points of the win percentage.
This is a relatively easy method to calculate for a large number of results, e.g. the 1000 NRL games or so played between 2014 and 2018 and the over 300 games played in the QCup in 2017 and 2018, so I’ve used it to evaluate Poseidon ratings overall. Poseidon compares favourably to Archimedes in the NRL and Euclid in the QCup, averaging about 61% success rate across all seasons, although it has been fairly dismal over the last few seasons of the NRL, averaging a smidge above 50% from 2016 through 2018.
That said, there are reasons we have a more complicated method.
Complex calculations
The complex calculations look at the actual odds of each team scoring each combination of tries (up to 10), conversions (up to as many tries have been scored) and penalty goals (up to 3) as calculated using Poisson and binomial distributions. The teams are treated independently of each other – that is, the probabilities of scoring don’t change if the teams are close or if it’s a blow out – but the Poseidon ratings account for their relative quality when you compare attack and defensive ratings, which we do in the same manner as described for the simple estimates.
This is what the soccer forecasts were doing but, unlike soccer, we have three scoring dimensions* to contend with, which means it’s hard to show the full breadth of scoring combinations (even within the limitations we have, there are 261 combinations) in a table. I could do it with just the points score but, again, it’s not a 6×6 table, it’s more like a 33×33 table. If you’re curious, this is what part of the calculation sheet looks like:
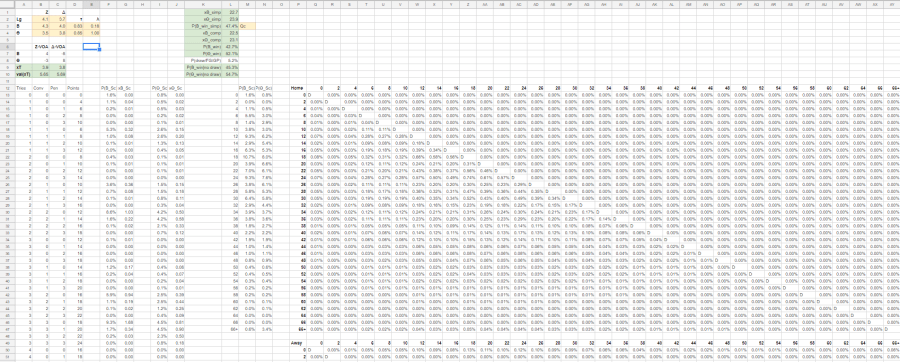
Once the spreadsheet has worked out all the probabilities, you can multiply the probability of each combination by the number of points it generates to calculate the expected score. We can also look at who wins each in scenario and sum the probabilities to determine each team’s chance of success.
I haven’t tested the complex calculation against the simple estimate, because of the amount of time that would take, but I expect it to be better. Sometimes it’s possible for a team to have a higher xSc but have a lower winning probability, which is counter-intuitive and interesting but it lends credence to the idea that what maximises your score, doesn’t necessarily maximise your chances of winning. We’ll see how 2019 pans out.
(Yes, to be honest, a smarter person than me would write a program to do this for them and never bother with the simple version but I use spreadsheets and am getting to an age where I can’t learn anything new. Or don’t want to, I forget which it is because I’m getting old.)
*Field goals are not included in these calculations. They are rare and generally only occur when the game is level. Trying to predict them will not noticeably improve the accuracy of the win probabilities. The reality is that when games are close, they move towards being a coin toss (see also this), so if you want the win probability for each team with no chance of a draw, you divide the probability of the draw/GP/FG scenario by two and add to each team.
