I made a decision a little while ago to forego the weekly recaps. Between doing weekly analysis pieces and a more time consuming tips process, there isn’t a lot of time left over and sprinting through stats every Sunday evening to get a post together for Monday isn’t much fun. It also was difficult to generate new stuff to say every week, especially when the forecasting tracks the form narrative very closely and the Indices didn’t come into play until the second half of the season. Really if you wanted a typical 500 word write-up of the weekend, you could hit up The Roar or Fox League or the NRL website, so I wasn’t adding anything new there. Instead, I want to strip it back to keep to graphs and tables which tell the story of the month that’s been better on their own.
This month, we’re looking at:
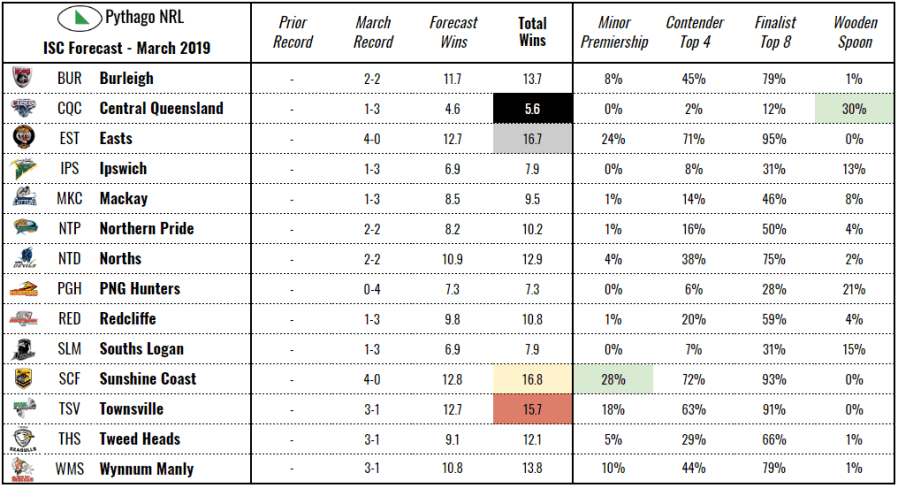
- The traditional Forecast, using the Stocky, which has been improved slightly with a top 4 percentage to help separate the contenders from the pretenders. As the season progresses, we can separate out a team’s individual positional chances if it proves interesting enough to do.
- Form Change, as measured by the change in form Elo ratings from the start to the end of the month. These will not necessarily be a close mirror of the win record, with some wins being more valuable in terms of assessing a team’s future prospects than others.
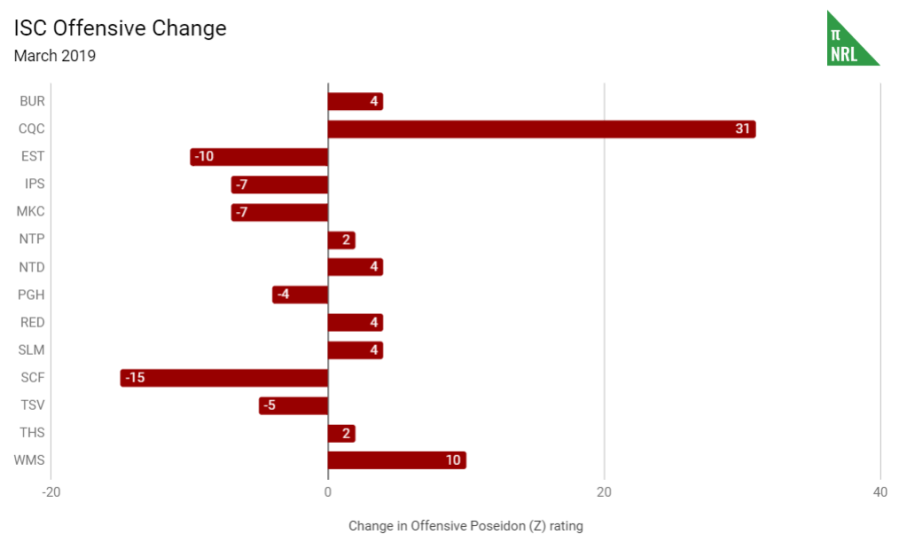
- Offensive and Defensive Changes, as measured by change in offensive and defensive Poseidon ratings. In an ideal world, you’d want your team to improve both but improving defensive ratings, or maintaining them if already high (see here for current ratings), is an important component to winning a premiership. At this early stage of the season, big changes are reflective of either some substantial early season luck or significant changes to the way the team plays. This changes will be tracked from the start of the season, rather than month to month.
- The Fortune Index, which compares actual win percentage to Pythagorean expectation to see which teams are outperforming their expectations and/or getting lucky and vice versa. We expect to see mean reversion take control for most teams at the extremes but there’s usually one or two that has a win percentage noticeably higher than their Pythag and another one or two that are noticeably lower.
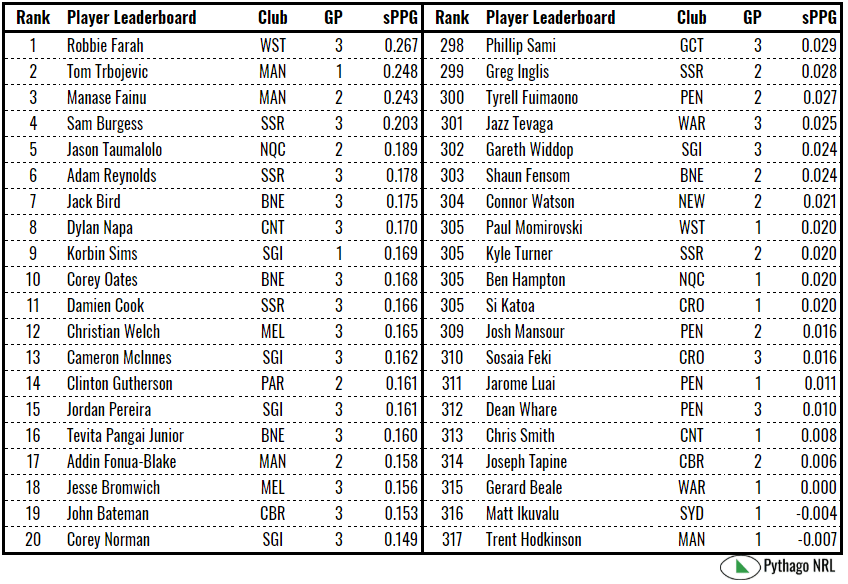
- The Player Leaderboard, which uses PPG to track the top and least performing players over the course of the season. Remember that it’s possible to significantly outproduce the positional average over one or two games but it’s difficult to maintain over a season. The best at the end of the season are usually around the .190 to .200 mark with average around .090. The leaderboard might change to WARG later in the year as players start to accumulate serious production, with a monthly look at PPG, and then we’ll see guys like Taumalolo fall off the pace.
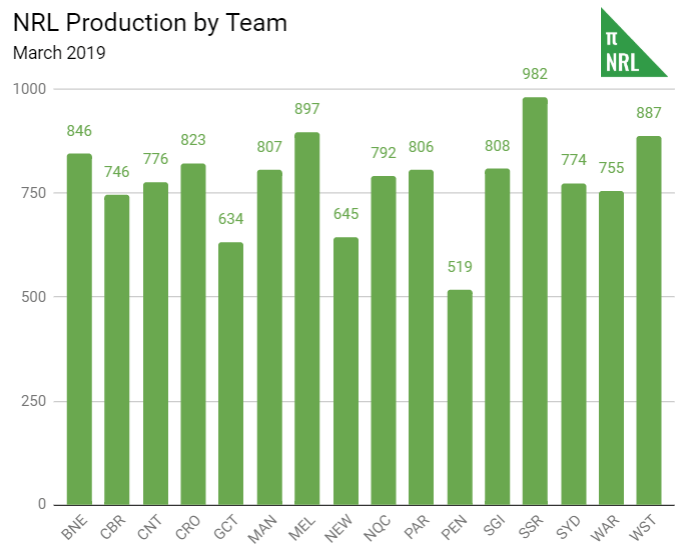
- Production by Team, which sums up the total production by team as calculated for PPG purposes.
The Disappointment, Panic and maybe Hope Indices will return later in the season as things get more interesting. I’d prefer to let the graphs do the talking but we’ll see what works.

National Rugby League


Intrust Super Cup