

The Stocky is the main forecasting tool driving the analysis on this site. It’s a simulator of the season ahead, using the Monte Carlo method and based on Elo ratings, that gives insight into the future performance of each club. My main interest has been the number of wins, as it determines ladder positions which in turn have a big impact on the finals. The Stocky might not be able to tell you which games a team will win, but it is good at telling you how many wins are ahead.
But how does a computer simulation (in reality, a very large spreadsheet) compare to reality? To test it, I’ve put together a graph of each team’s performance against what the Stocky projected for them. Each graph shows:
- The Stocky’s projection for total wins (blue)
- Converting that projection to a “pace” for that point in the season (red)
- Comparing that to the actual number of wins (yellow)
It will never be exactly right, particularly as you can only ever win whole numbers of games and the Stocky loves a decimal point, but as we’ll see, the Stocky is not too bad at tracking form and projecting that forward.
This week is Part I, from Brisbane to Newcastle. Part II, from North Queensland to Wests Tigers, will be next week.
 Brisbane Broncos
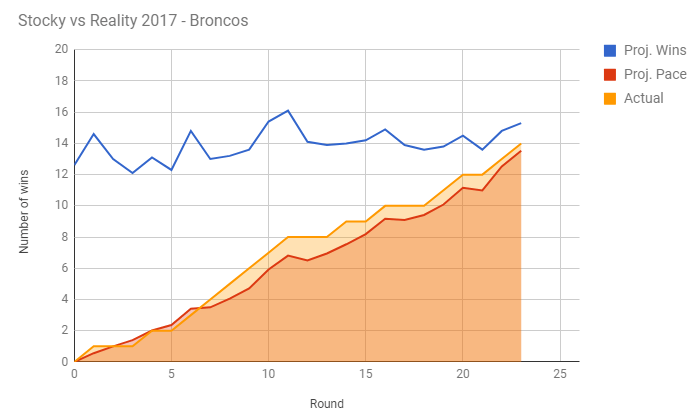
Record: 14-7 | Position: 2nd
The Stocky has had the Broncos pegged pretty early on. Brisbane’s projected number of wins hasn’t moved much outside the twelve to fifteen range all season, which is enough to secure a top eight spot. Recent performances are seeing that projection climb closer to fifteen, although with three games to go and the Broncos already sitting on a 14-7 record, sixteen wins doesn’t seem out of the question. Brisbane are looking good for a grand final spot if this continues.
 Canberra Raiders
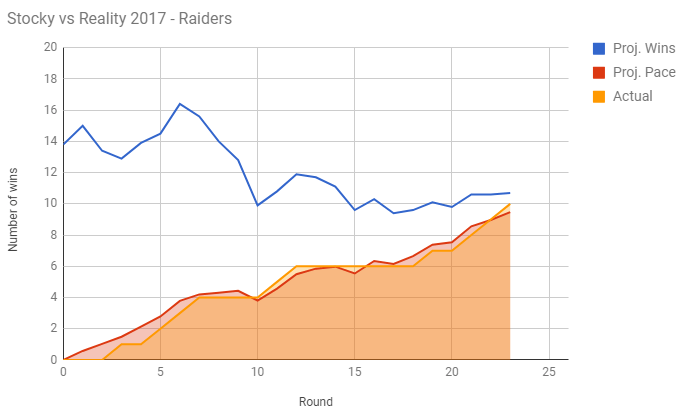
Record: 10-11 | Position: 10th
Few teams have failed to live up to expectations as much as the Raiders in 2017. After securing second spot last year and staring down the barrel of not even playing finals footy this year, they have at least bottomed out in mid-season and are slowly improving. The Stocky only has them at a one in ten chance of making the finals; Canberra are the literal definition of needing a bunch of results to go your way to find success. There may be one or two more wins in store but it won’t be enough.
 Canterbury Bulldogs
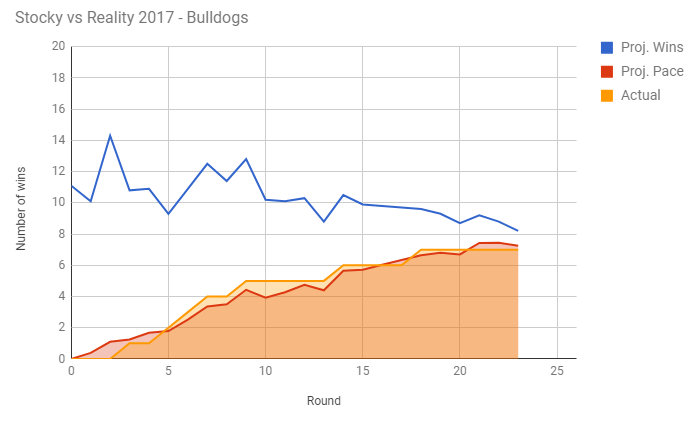
Record: 7-14 | Position: 13th
The Bulldogs have also been disappointing this year, but at least they were consistently disappointing in the back half. The blue line has been in a shallow downward trend since the start of the season. The Stocky got to grips with the real Bulldogs, not the fake ones that managed a win over Brisbane early in the year, by about round 12 or 13 and has tracked closely to Canterbury’s actual win pace since. With nothing left to play for, other than avoiding the wooden spoon, the Doggies may as well start thinking about going to Bali.
 Cronulla Sharks
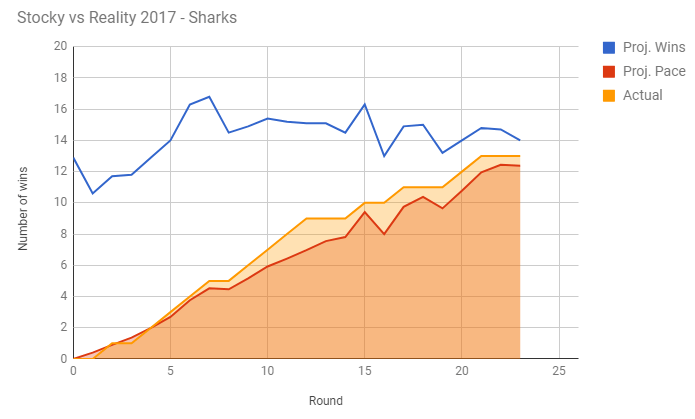
Record: 13-8 | Position: 4th
Cronulla have done well this year, particularly outperforming the Stocky’s more conservative expectations from about round 6 onwards. The gap is starting to close as the Sharks’ performance reverts to mean, losing some form towards the run to the finals. The Stocky only has one more win in store for the Sharks, which given recent games, seems fair enough. That might even be enough for fourth place given the teams around them on the ladder.
 Gold Coast Titans
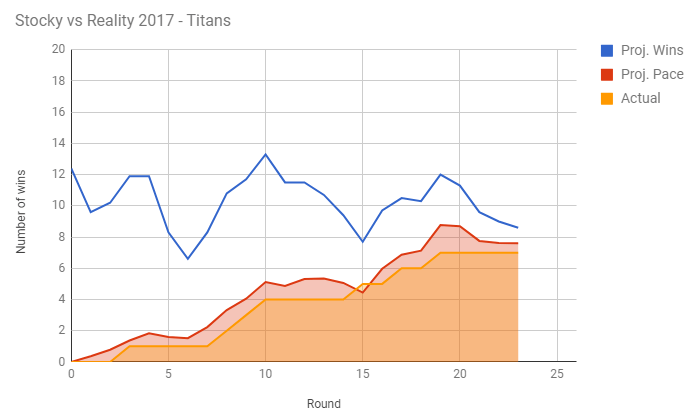
Record: 7-14 | Position: 14th
The Titans have had an incredibly bumpy ride this year. They’ve done just enough to keep clear of the Knights on the ladder, if not on the field, and knocked off some big scalps along the way, including the Storm (one of only two losses for a full strength Storm side in 2017) and the Sharks (twice). It’s the little scalps the Titans haven’t managed to take and that’s reflected in the team’s under-performance against the Stocky. Unless it was pure luck, if you can beat the big teams, why not the little ones? Given the off-field drama of the last week, I’d be setting my expectations pretty low for the remainder of the season. The Stocky can’t capture that but I don’t see anymore wins forthcoming.
 Manly Warringah Sea Eagles
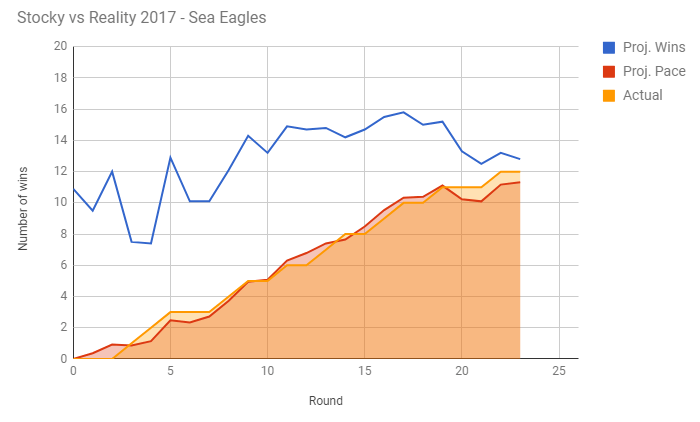
Record: 12-9 | Position: 1st
Remember when we all thought the Sea Eagles were premiership contenders? Boy, how we laughed when they got belted by the Dragons and then lost to the Tigers. You can see the exact point their form started to fall off a cliff because its where the blue line starts going down after round 17. It took the Sea Eagles a while to get going and I think they’ll be closing out the season the way they started. It’ll be enough to get Manly into an elimination final and possibly even into a semi final. Despite their rise and fall, the Stocky has done a good job of tracking their performance throughout the year.
 Melbourne Storm

Record: 17-4 | Position: 1st
The Storm went literally off the chart, albeit briefly, at round 15. Much like the rest of the league, the Stocky hasn’t been able to keep up with the Storm’s march to the minor premiership but, for future reference, this is the chart you want your team to emulate. The blue line pretty much only goes up and the actual number of wins outpaces the projections comfortably. The 2017 Melbourne Storm are very good but you didn’t need the Stocky to tell you that.
 Newcastle Knights

Record: 5-16 | Position: 16th
Which brings us to the other end of the spectrum. The near intersection of blue, yellow and red suggests that the Knights are almost done winning games, although they’re probably about 20% – 30% chance of winning any given game between here and the end of their season. The Stocky expected Newcastle to lift themselves off the canvas at some point mid-season and their recent turnaround is good news for next year. The Stocky still has them pegged as the wooden spooners but I doubt that will be the case next year.
