Why a three-quarter season review? We could ask Penrith the very same question but for me, it’s because I was too busy with life around round 12 and I will be on holidays and away from the computer by round 25, so this is the only real opportunity I get to pull together a post reviewing the season that’s been until sometime in late October. I think now is a good time to do it anyway because the narratives are established and we’re just close enough to peak over the fence into how the conclusion to the 2018 NRL campagin might play out.
I’m going to try and limit my word usage and let the graph and/or table do the talking. Feel free to use the contents page to jump around:
Jump ahead
- Teams
- Players
- Finals outlook
Teams
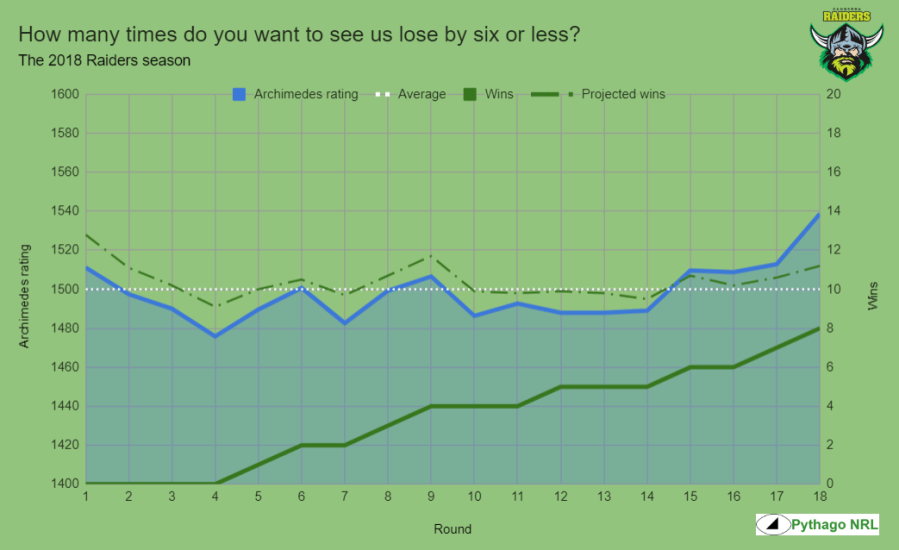
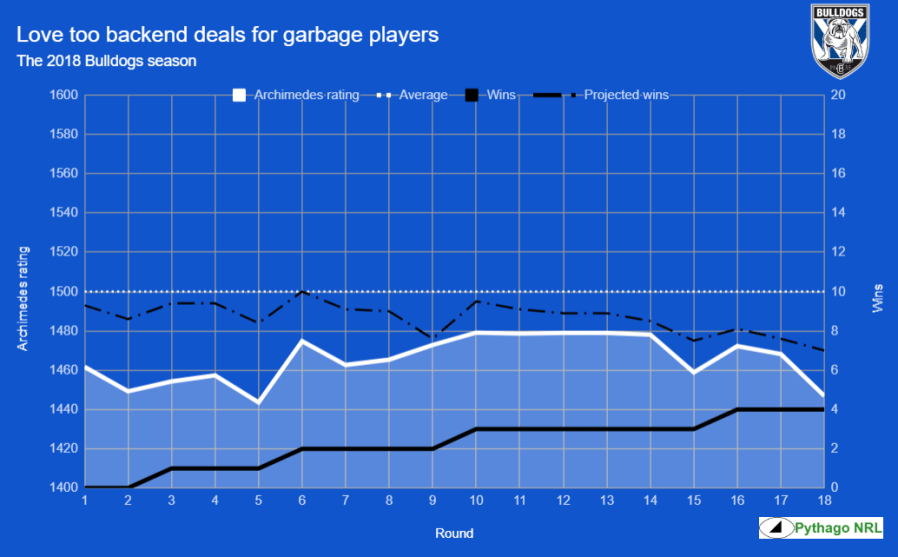
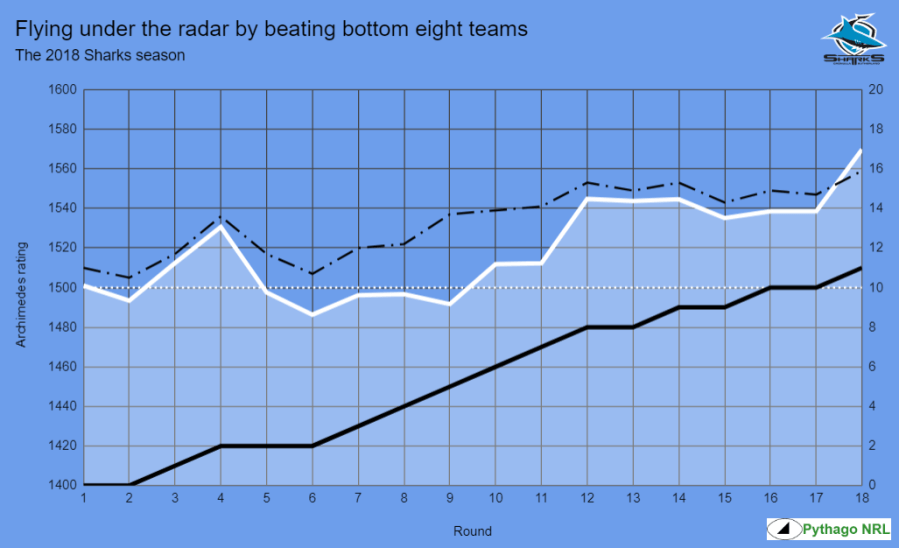
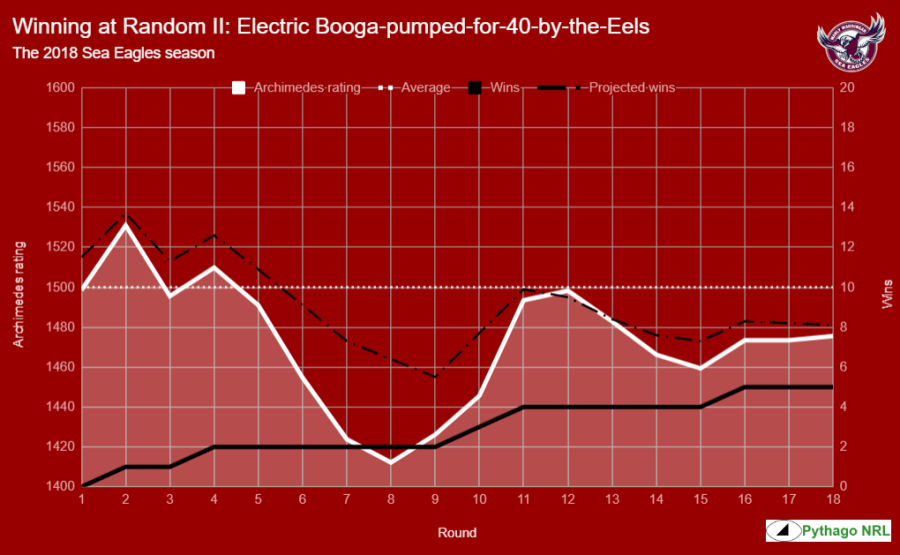
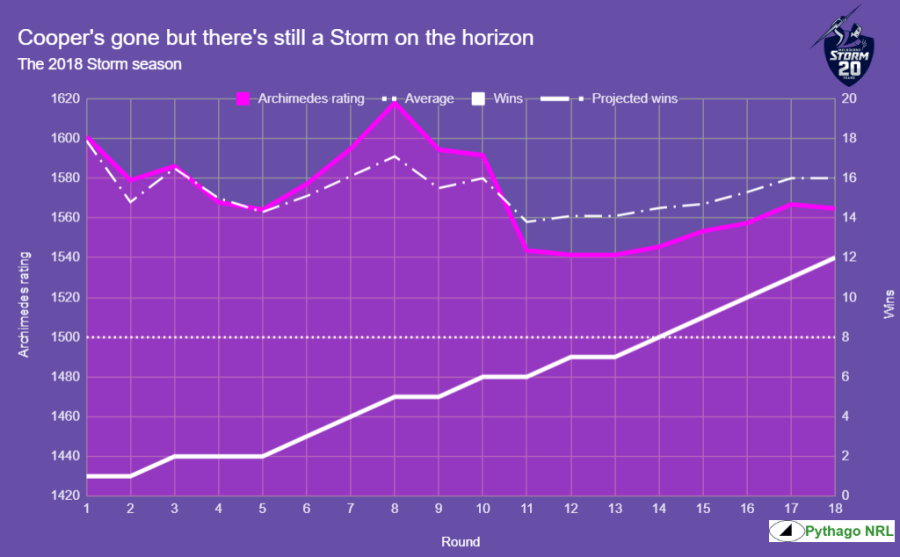
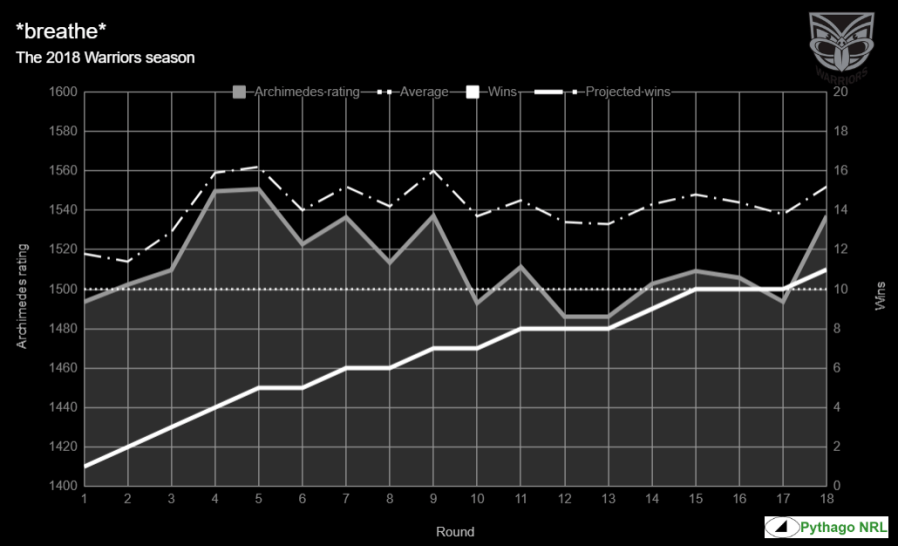
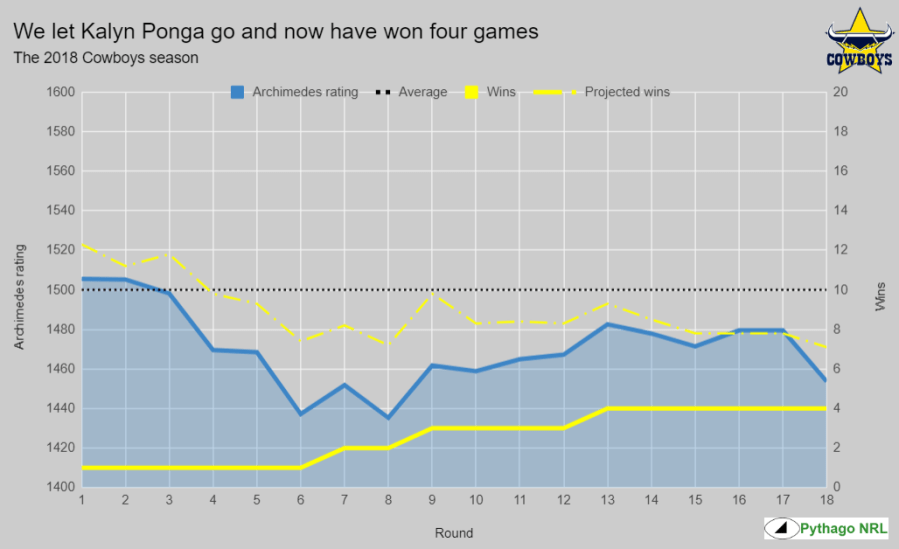
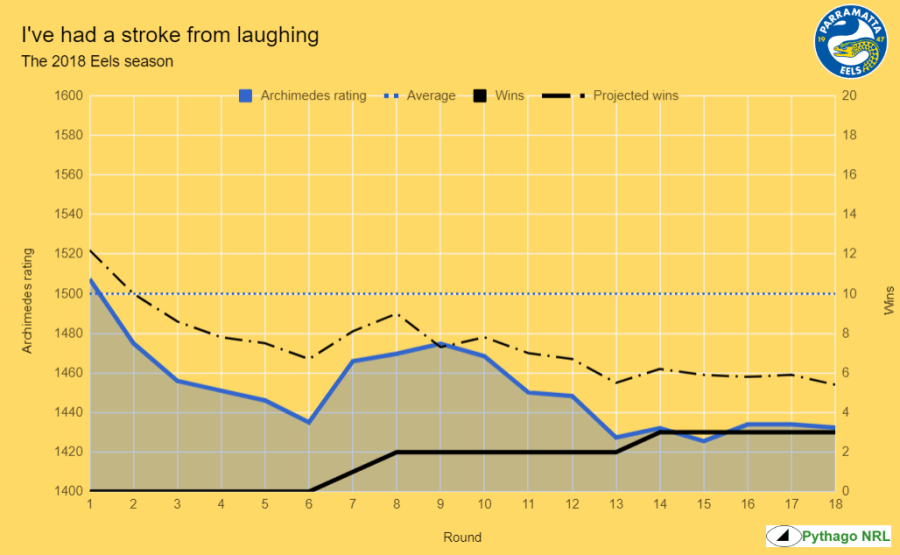
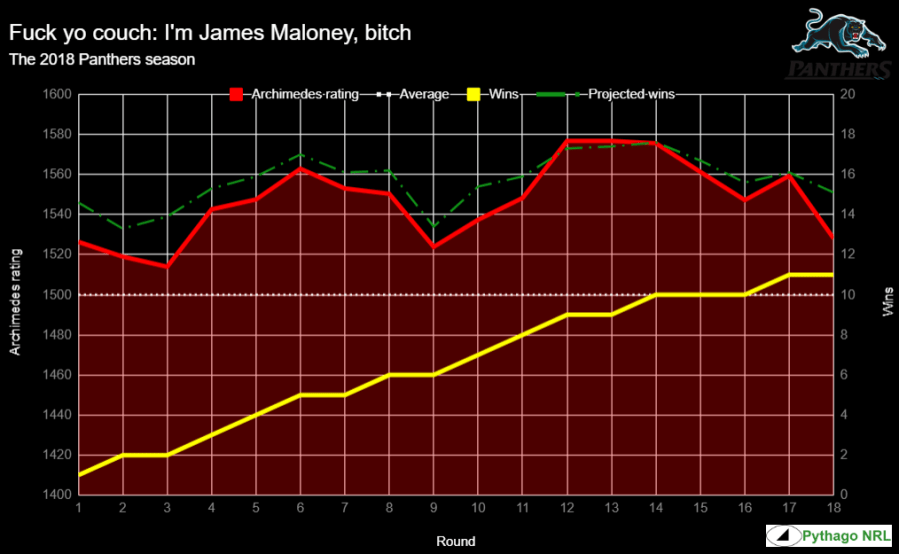
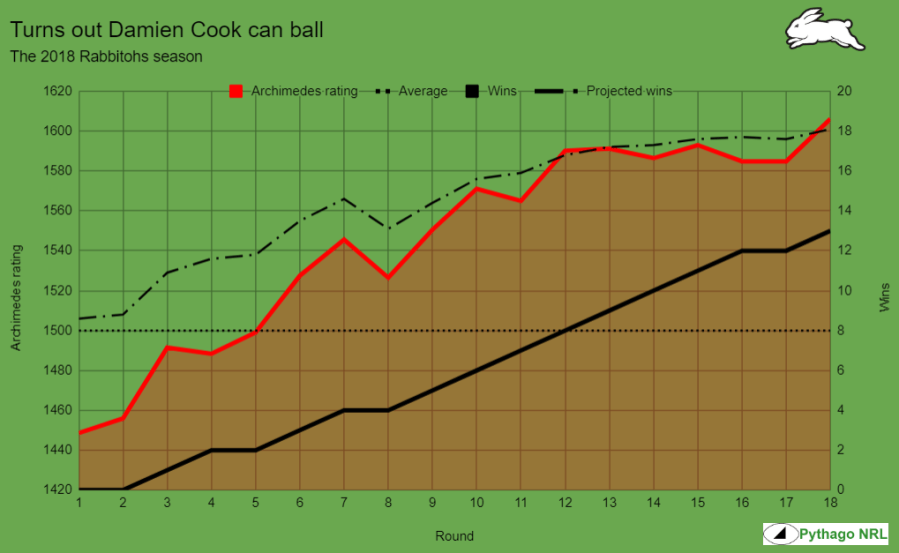
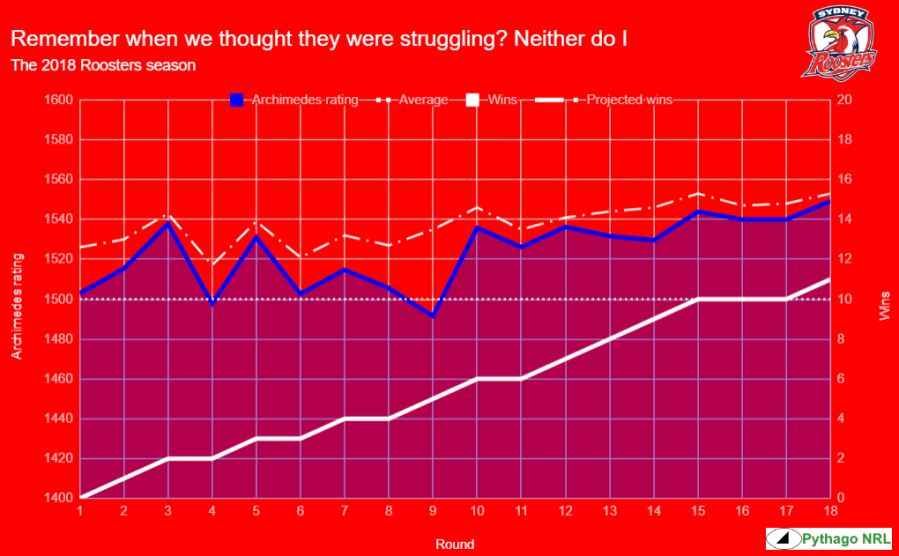
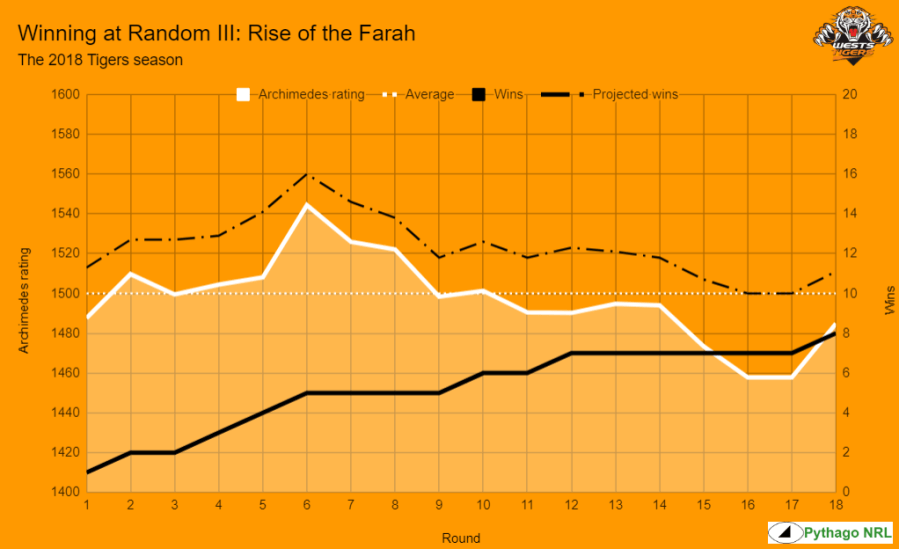
For each team, I’ve plotted their Archimedes (form) Elo rating for the 2018 season on the left axis and the number of wins and the number of projected wins from the Stocky at each point in the year on the right axis.
 Brisbane Broncos

 Canberra Raiders
 Canterbury Bulldogs
 Cronulla Sharks
 Gold Coast Titans

 Manly Sea Eagles
 Melbourne Storm
 Newcastle Knights

 New Zealand Warriors
 North Queensland Cowboys
 Parramatta Eels
 Penrith Panthers
 South Sydney Rabbitohs
 St George Illawarra Dragons

 Sydney Roosters
 Wests Tigers
Players
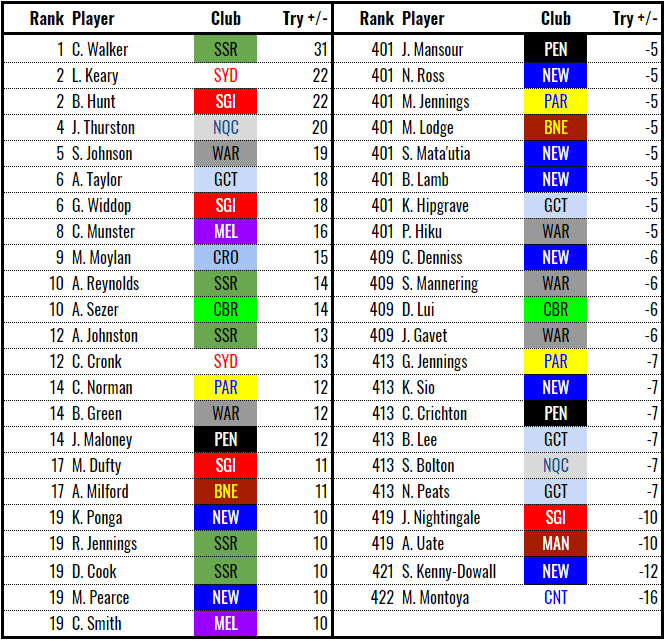
Try +/-
As introduced during the rep weekend, plus/minus is a player’s total try involvements less their try causes. It shows whose defensive failings on the line are outweighed (or not) by their attacking contribution. At a team level, Try +/- has a correlation coefficient of 0.62 with wins so far this season.
Tkl +/-
Tackle plus/minus is like the try plus/minus but it is the difference between a player’s tackle busts and their missed tackles. There is some debate as to whether tackle busts matter (in practice, the breaking of a tackle slows down the attacker enough that another defender will usually be able to effect a tackle) but TB does have a moderate correlation with winning percentage. Missed tackles have no correlation with wins and don’t seem to matter in the grand scheme. This is one reason why MT, and tackle efficiency for that matter, are not particularly useful statistics.
Tkl +/- has a correlation coefficient with wins of 0.23 at a team level. It has no correlation with Try +/- at a player level. Tkl +/- highlights a very different kind of player: one who is self-reliant in defence but also capable of giving the opposition a tough time on offence.

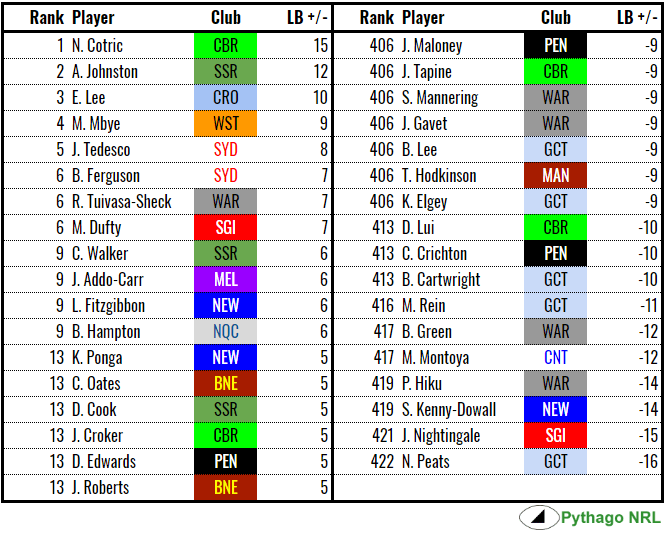
LB +/-
Line break plus/minus is the difference between a player’s line breaks less their line break causes. LB +/- is similar to Tkl +/- but unlike individual tackles, line breaks matter. A team who can create line breaks is a team that can score points and vice versa. LB +/- and Tkl +/- have a correlation coefficient of 0.31 and with Try +/-, 0.14. At a team level, LB +/- has a correlation coefficient of 0.34 with winning so far this season.
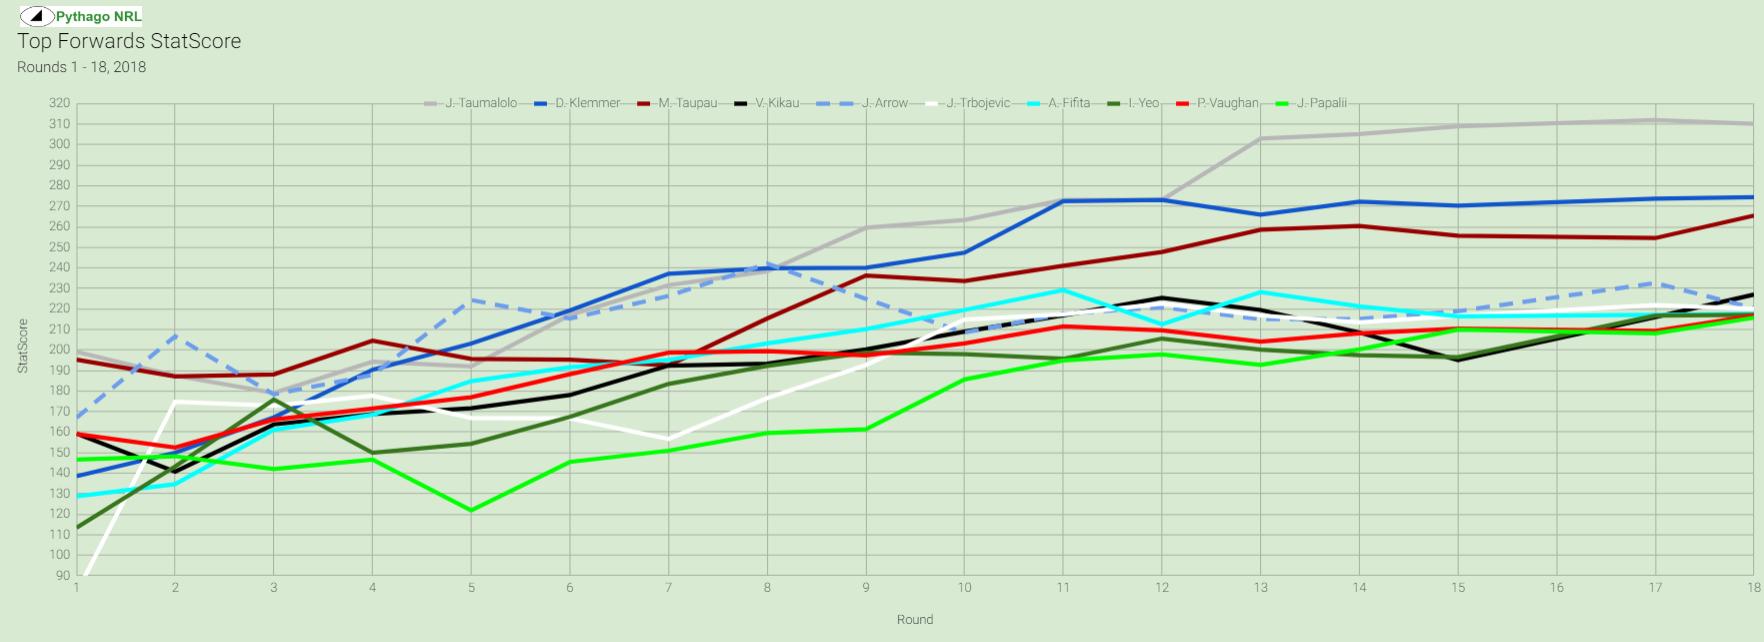
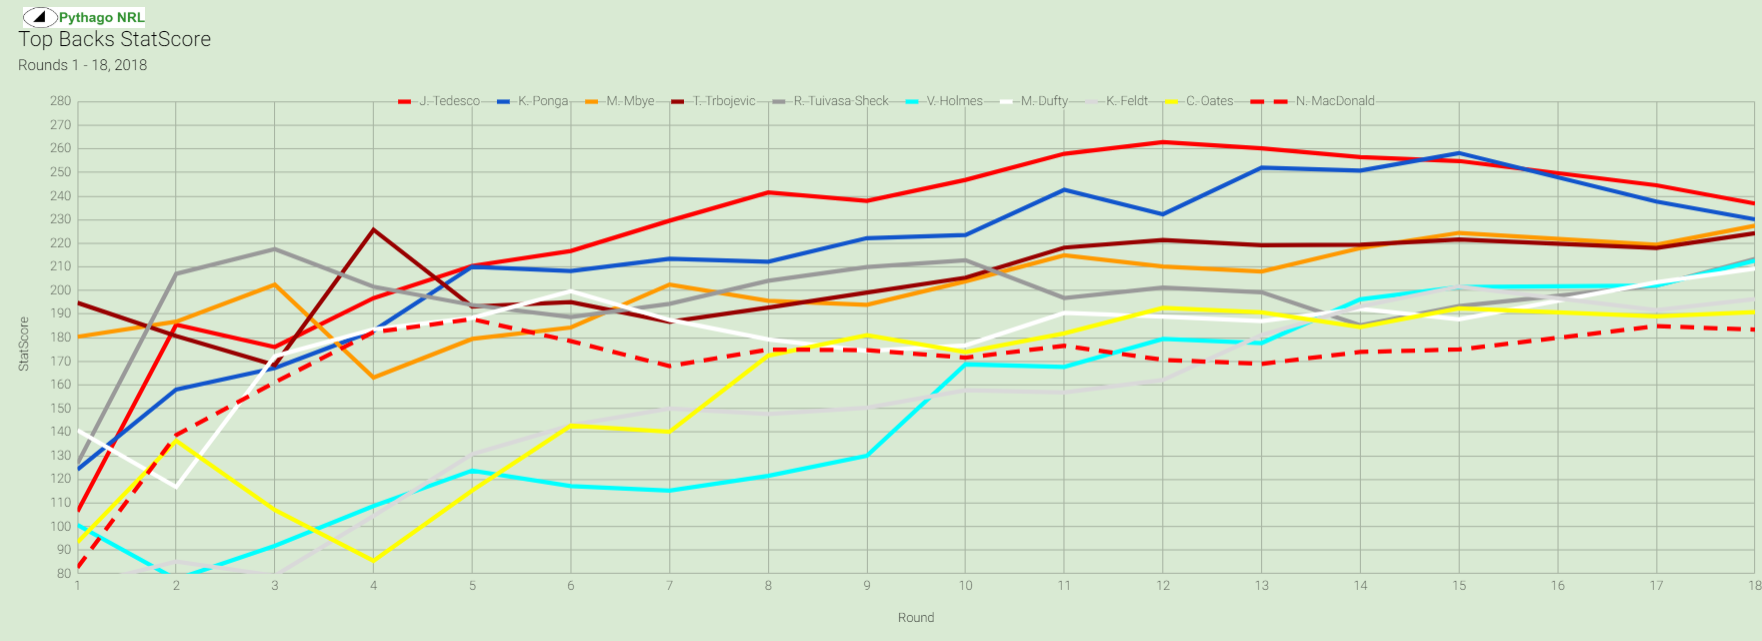
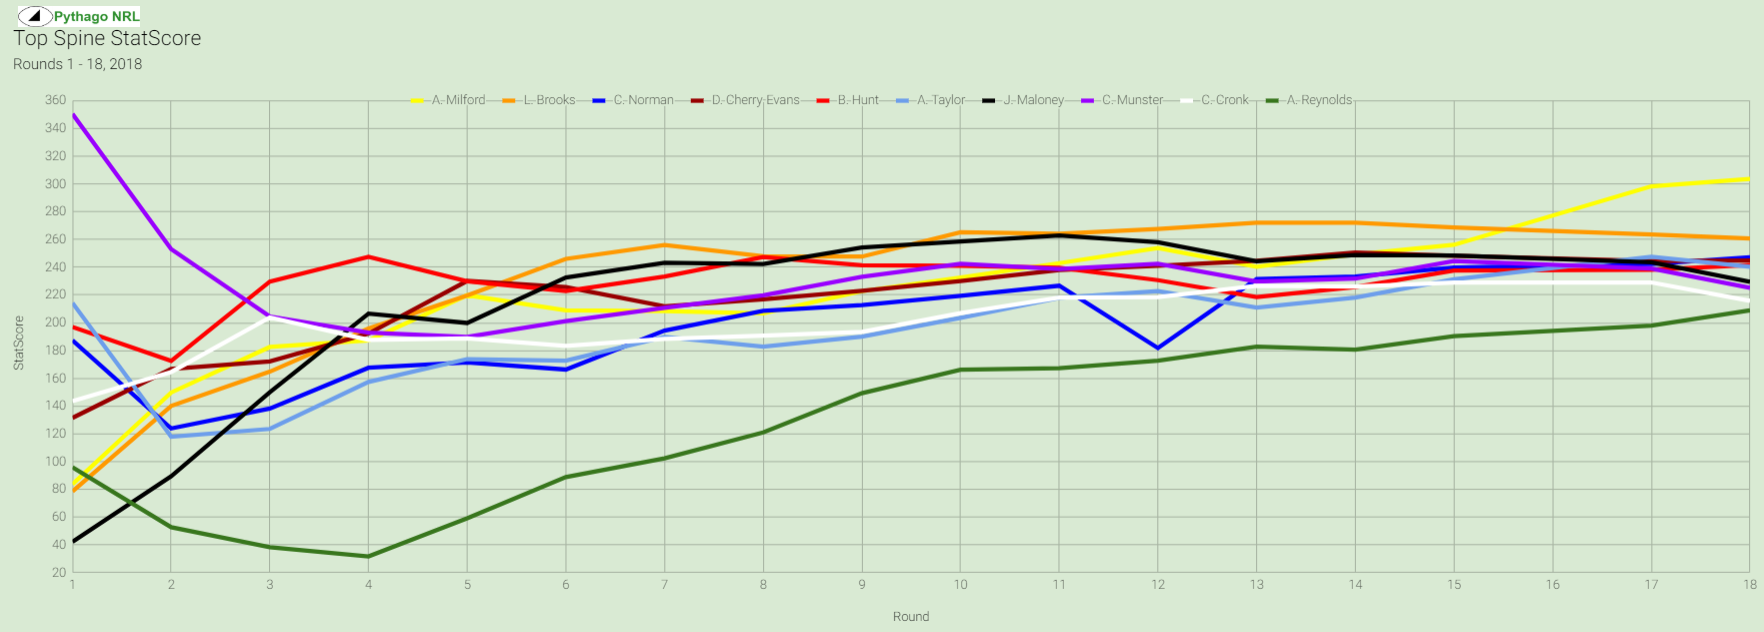
StatScore Leaderboard
See more here for StatScore and its practical applications.

Click to open the following graphs in a new tab that you can zoom in on.
I’ve taken the ten top players in each role and graphed their round-by-round production (that is, their raw weighted stats without reference to the role average) and their rolling StatScore. I forgot to separately collect the data for round 16, so that’s missing from the production graphs.
Top Forwards

Top Backs

Top Spine

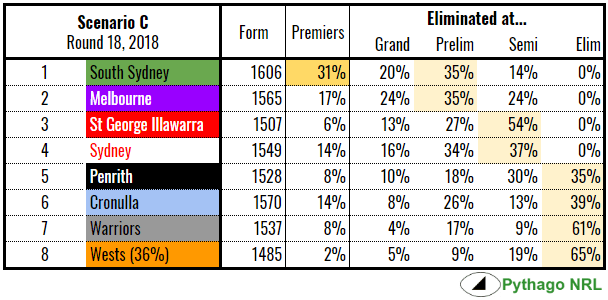
Finals Outlook
For the first time this year, I’m going to break out the Finals Stocky, which is a version of the Stocky that simulates the finals series 5,000 times over to determine who is likely the premiership winner. The Finals Stocky made it’s first appearance after round 19 last year, if you need a bit more explanation.
I’ve run Stocky for each of the three likely scenarios based on today’s ladder. Scenario A is the Broncos finish eighth, B is the Raiders and C is the Tigers in the final playoff position. I have indicated the likelihood of each team making the finals, per this week’s recap.
Note that neither the form ratings nor the finals positions are locked in and that as contenders re-rate and shuffle in the pack, this will affect the outcomes of the Finals Stocky considerably.