

To not put too fine a point on it, the Broncos have been shockingly bad in 2019. Riding the hype train in this year, they were touted as premiership contenders (disclosure: including by me).
The Broncos have won just two games. One was against a Cowboys side that is facing similar struggles and another against a Sharks team bereft of its star power. The other six games have been losses, ranging from a late field goal from Corey Norman sealing the win for the Dragons, to thirty-two point demolitions at the hands of Easts and then again from Souths.
The finger pointing has begun. The Broncos’ extremely youthful pack has come in for criticism, both for a lack of go-forward and a lack of consistency.
The statistics tell a different story.
Let’s start with Production. The definition of production is valuable worked done as measured by the accumulation of stats that correlate with winning. This includes things like running metres, hit ups, tries and assists. Errors and missed tackles count against.
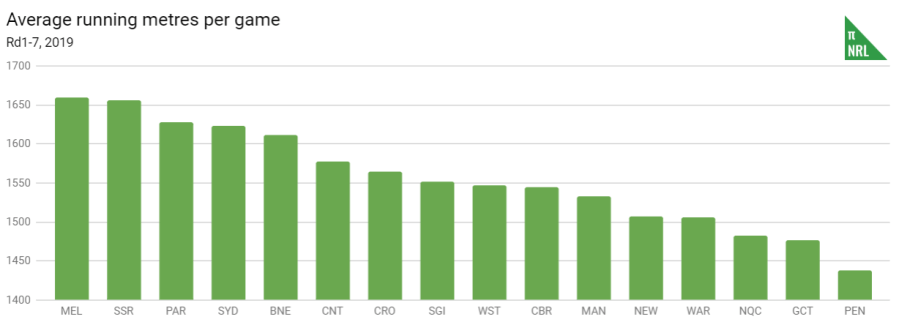
This is the Production for each club’s starting forwards across the first seven rounds for the NRL.
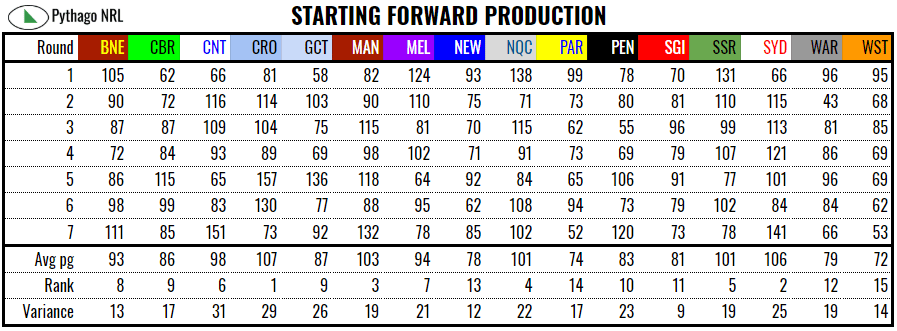
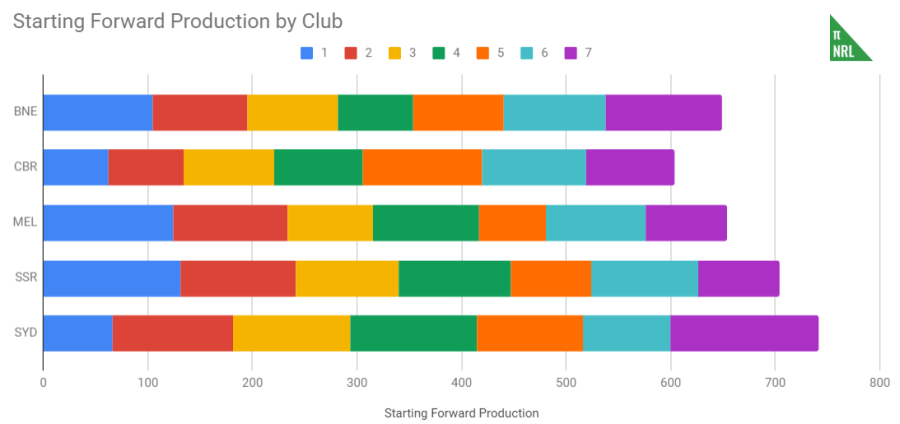
While the Broncos’ numbers overall are 3% above league average, this puts them the in the same ballpark as the Storm and the Raiders packs, although well behind the Roosters and Rabbitohs. Remember that the argument I’m making is not that the Brisbane pack is fantastic. The argument is that they are doing enough to keep pace with top eight teams and a lack of go-forward doesn’t explain the Broncos’ dismal start to the year.
Just as importantly, Brisbane’s forwards have a lower variance in their production than the league average and therefore have a higher level of consistency. Inconsistency is not the issue.

You might want to argue that production, being a volume measure, is not adjusted for the minutes played by the starters and so might be concealing the depth in other squads. You might be on to something except, by PPG, which is adjusted for minutes played, the full strength Broncos’ pack is more than capable.
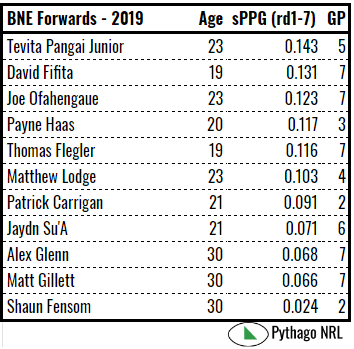
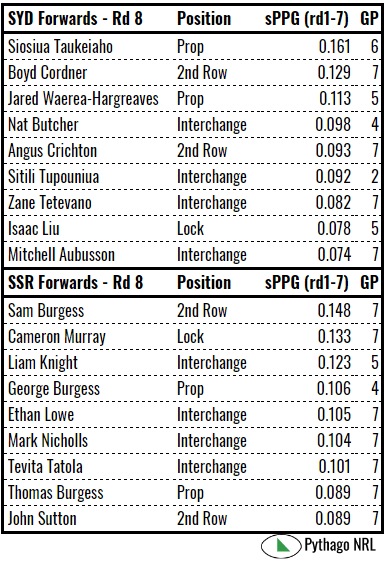
With a league average PPG of .090, the Broncos could select seven players that have performed above that benchmark. Compare this to the most recently named forwards for the Roosters and Rabbitohs:
If anyone is to be blamed for any issues up front, it’s the veterans in the second row. To be fair to Matt Gillett, he’s been played out of position and spent most of the first seven rounds babysitting Kodi Nikorima. My question is what is Alex Glenn doing to be starting while David Fifita gathers dust on the bench?
If you don’t believe any of these metrics, the Broncos are fifth in the league for running metres, a stat which has a strong correlation with winning and forward performance.
Ultimately, averaging 1612m should win you more than 25% of your games. If that sounds familiar, it is similar to Anthony Seibold’s “five line break is enough to win you a game, 22 points is enough to win you a game” comment following the Broncos’ loss to the Raiders. Only one look at the Titans’ record over the last few years is required to see the success generated by prioritising offence at the total expense of defence.
That said, teams that run between 1600m and 1650m win approximately 60% of their games. The Broncos are running like a team that should rate about 1570 on Archimedes ratings but have so far only been able to average 1492, a number flattered by carrying significant form forward from last season.
We’ve established that the young forwards have enough get up and go and that they are consistent in doing so. Where is this discrepancy in performance coming from?
There are many contenders but by far the grossest part of Brisbane’s game is their defence. Poseidon currently rates the Broncos’ defence slightly worse than Newcastle, about the same as the Gold Coast and only better than Manly (for now).
Red zone efficiency, that is how many times a team scores as a ratio of their visits to the opposition’s twenty metre line, is not something I track but the efficiency generated by the Broncos’ opposition has to be the best in the league. For nearly every visit the Raiders, the Sharks and the Rabbitohs made to the Broncos’ red zone, they scored. Brisbane were only able to beat Cronulla’s reserve grade fill-ins on an excess of possession and field position that will not be repeatable against first grade sides.
Defence is ultimately about communication, organisation and leadership. The absence of these virtues at Red Hill has been well documented. While it’s fun to blame McCullough’s unserviceable service or Boyd’s arthritic inability to catch the football and return it, the reality is that there are broken systems in desperate need of repair that affect the whole team. The solution needn’t come from the captain or the most experienced players or the best paid but it needs to come from someone.
The Broncos are already 2-6. The worst ever Broncos team – Anthony Griffin’s 2013 side – still managed to win no fewer than ten games. The class of 2019 would need to close out the remainder of 2019 with a 8-8 record to even achieve that lofty goal. This does not even consider finals football as a goal, for which Brisbane will need another two or three more wins again. Their Pythagorean expectation has the Broncos winning only another six.
The good people of Brisbane will only tolerate that level of performance for so long.
