By the way, it’s not just your imagination. If you, like me, have been wondering whether rugby league is somewhat lopsided so far this year, I don’t think you’re wrong. In the NRL, there are by some metrics only six teams above average and really only two of those – Souths and Easts – are excelling. I look forward to them not playing a grand final because rugby league is too chaotic to allow that to happen.
Also, Penrith are looking decidedly unhealthy. They are spoon favourites and down on more than a few metrics. That’s quite surprising to see the incumbent NSW halves pairing lead around a team that could be the worst in a league that also contains the Bulldogs, Knights, Broncos and Titans.
The Sunshine Coast Falcons dismantled the Souths Logan Magpies 72-4 to continue their unbeaten run. While the scoreline itself was close but not an actual record, this has promoted the Falcons’ form rating to 1663, which is extremely high. For comparison, think North Queensland Cowboys at the end of the 2015 regular season, heading to their first premiership. The 2016 Dolphins, the 2015-16 Blackhawks and the 2013 Pride hit similar marks but it has been largely unprecedented in the fifteen years prior of the Queensland Cup. I suppose this speaks to a greater disparity in talent across the league that wasn’t present in earlier years, even though those early years often resulted in teams folding after winless seasons, which is something of a paradox that I don’t have a resolution for.
(I did have an incredibly salty take ready to go about Sydney-centrism in rugby league. One day, the words will pour forth from me in a coherent manner and the end product will be enjoyable to read but Sunday afternoon was not that day. But I will say this: you have a new stadium, we get it. Bravo. I was excited for you but I’m not any more. Can we please talk about something else?)
As per last month’s recap, we’re looking at:
- The traditional Forecast, using the Stocky, which has been improved slightly with a top 4 percentage to help separate the contenders from the pretenders. As the season progresses, we can separate out a team’s individual positional chances if it proves interesting enough to do.
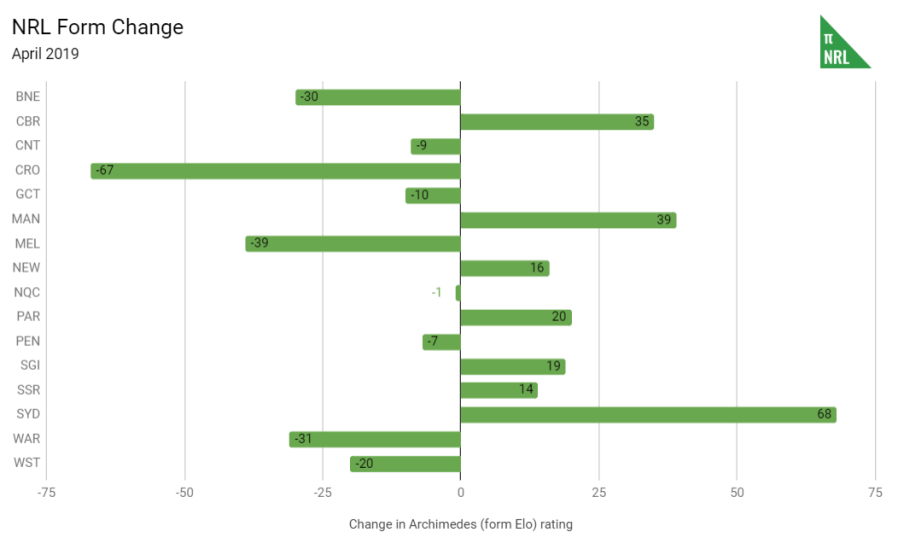
- Form Change, as measured by the change in form Elo ratings from the start to the end of the month. These will not necessarily be a close mirror of the win record, with some wins being more valuable in terms of assessing a team’s future prospects than others.
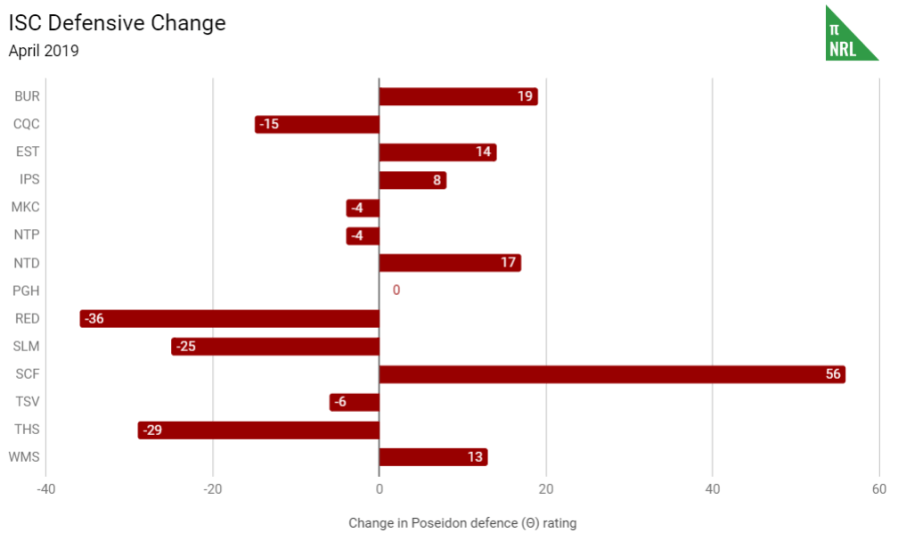
- Offensive and Defensive Changes, as measured by change in offensive and defensive Poseidon ratings. In an ideal world, you’d want your team to improve both but improving defensive ratings, or maintaining them if already high (see here for current ratings), is an important component to winning a premiership. At this early stage of the season, big changes are reflective of either some substantial early season luck or significant changes to the way the team plays. This changes will be tracked from the start of the season, rather than month to month.
- The Fortune Index, which compares actual win percentage to Pythagorean expectation to see which teams are outperforming their expectations and/or getting lucky and vice versa. We expect to see mean reversion take control for most teams at the extremes but there’s usually one or two that has a win percentage noticeably higher than their Pythag and another one or two that are noticeably lower.
- The Player Leaderboard, which uses PPG to track the top and least performing players over the course of the season. Remember that it’s possible to significantly outproduce the positional average over one or two games but it’s difficult to maintain over a season. The best at the end of the season are usually around the .190 to .200 mark with average around .090. The leaderboard might change to WARG later in the year as players start to accumulate serious production, with a monthly look at PPG, and then we’ll see guys like Taumalolo fall off the pace.
- Production per game by Team, which sums up the total production by team on a per game basis as calculated for PPG purposes.

National Rugby League


Intrust Super Cup