Using the same format I used during the rep weekend, this is the finals preview-ish post.
I didn’t get to do all the analysis I wanted to because I’ve run out of time. By the time this gets published, I should be somewhere in or around California starting my honeymoon, which I think should probably take priority. I won’t be filing from America (in fact I probably won’t see any rugby league for six weeks) but I will be back in October or November to do some post-season stuff.
This post relies pretty heavily on Elo ratings, so you might want to brush up.
1. Who is going to win the premiership?
Good question. I ran the Finals Stocky one last time based on the end of regular season Elo ratings and look what it computated:
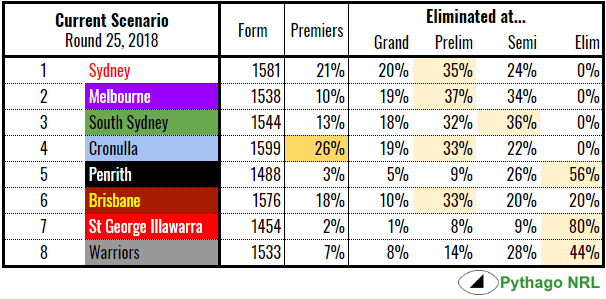
Up, up bloody Cronulla, hey? Ugh.
Cronulla have had a strong run in to the finish of the regular season, reflected in their relatively high rating, although most years that would only be good enough for the second or third best team. In fact, premiership chances are pretty well sorted by rating. The Roosters’ big win over the Eels has probably artificially inflated their chances and likewise Penrith’s win over the Storm – brought on by Melbourne taking the opportunity to rest a slew of star players with the home qualifying final locked up – inflates/deflates their ratings respectively. Realistically, you should be able to tack on a few more percentage points for Melbourne’s premiership chances.
Brisbane is an interesting case study. Unlike their colleagues in the second four, the Broncos are currently more likely to be sent home after a preliminary final than in the elimination final on Sunday against the Dragons (potential revenge game for round 1, although it feels like any time there’s this level of build up, the Broncos fall short so I don’t really expect them to be lifting a premiership trophy this year) or their semi final against the loser of the Storm and the Rabbitohs. Obviously, if they meet Melbourne at any stage of the finals series, they’ll be out but otherwise, Brisbane have shown they have the measure of any other top eight team.
With four teams being ‘most likely’ to be eliminated at the preliminary finals, it’s worth remembering that the odds of picking a correct bracket are roughly 1 in 512 and much like the lotto, it’s basically impossible to win it and yet someone almost always does. The most likely scenario is, ironically, unlikely to be the scenario that plays out because there are so many finals pathways for each team.
2. Is this the worst top 8 in NRL history?
Another good question. The answer is no.
The closeness of this year’s top eight, with a whole single win as the difference between the minor premiership and eighth place, might engender feelings that this year’s cohort of finalists are a tad on the mediocre side. That’s not quite the case.
I’ve grabbed the average end of season Archimedes rating for the top eight each year of the NRL (I’ve ignored that 1998 had ten finalists) and separated out the top four from the second four to see which season had the worst class of finalists.

2018 is actually the second worst finals cohort in NRL history. The 2005 season produced worse finalists, with Brisbane, Cronulla and Manly all registering sub-1500 ratings going into September. Somehow Canterbury and Canberra were even worse that year (obviously not making the finals) and St George Illawarra and Parramatta well ahead of the competition. Of course, neither went on to even play in the grand final.
2007 produced the worst quality finals teams in NRL history with the North Queensland Cowboys (1493) taking on Canterbury Bulldogs (1492) in the first week. It has been the only finals game with two teams under 1500 and with Brisbane moving into sixth, we won’t have to suffer that again this year. The most lopsided matchup was between Sydney (1609) and Canberra (1424) in 2004, which generated a MVR of less than 30 (basically about the same as when the Roosters played the Cowboys in round 21 this year).
This year, St George Illawarra and Penrith are well below average and, with no standout team this year, like the Storm in 2017, there’s no particularly high ratings to drag the finalist average up.
At the top, 2013 produced the highest overall quality finalists, the last year that the Roosters won the premiership, although 2015 had a better top four by some margin, with Brisbane, North Queensland, Sydney and Melbourne more or less at the peak of their powers.
3. Which club is the best finals team?
Would you believe the answer is the Wests Tigers?
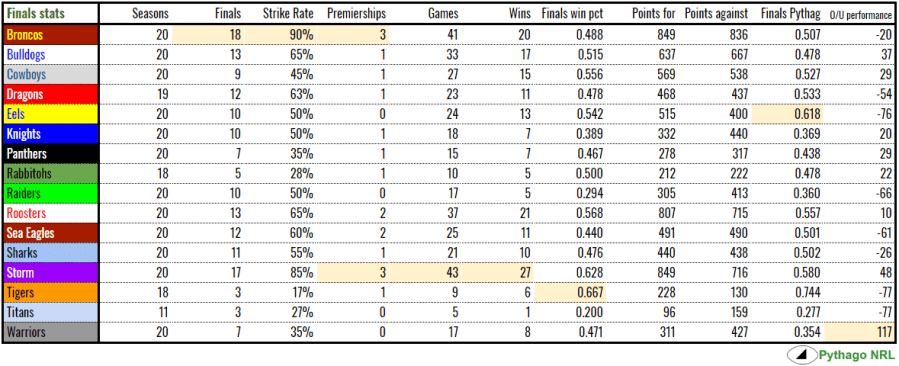
While the Storm may have played more finals games and taken more Ws, the Tigers actually have a better win rate from their three NRL finals campaigns, including their premiership year in 2005. That said, we just pointed out that 2005 was the lowest quality top eight in NRL history.
Brisbane have the best strike rate for finals appearances, which have yielded as many NRL premierships as Melbourne over the last two decades. Interestingly, the Eels have the best Pythagorean expectation (and have underperformed woefully by comparison, indeed as badly as the Tigers and Titans) and the Warriors have the highest outperformance of win percentage compared to Pythag.
4. Pythago Titles
Back to the Sharks and they finished as the top rated team, winning the Pythago Shield, which is for the team with the highest Archimedes rating at the end of the regular season (of course, there’s also the Pythago Spoon for the team with the lowest rating). Think of them as our equivalent of a minor premiership and the wooden spoon. Sharks added their second Shield to their previous win in 1999. The Knights take home a third Spoon, joining 2007 and 2016 (the Titans picked up the Spoon last year) in Newcastle’s collection.
Based on the final Finals Stocky, I’ve tabulated the xPremierships for this year. Cronulla go in as favourites and a candidate for a potential choke should they not deliver with a grand final win. They are definitely not as dominant as previous favourites going into the finals. Compare the Sharks’ 26% likelihood to the more dominant xPremierships over the NRL era: last year’s Storm (52%), 2015’s Roosters (47%), 2008’s Storm (48%) and 2001’s Eels (46%). Of previous premiers, Cronulla are on par with the 2006 Broncos (27%), the 2010 Dragons (27%) and the 2013 Roosters (25%).

The Tigers’ asterisk is for the two Spoons claimed by Western Suburbs in 1998 and 1999 that didn’t go into their total. North Sydney also picked up the Shield in 1998.
And in case you were wondering, the current Unofficial NRL Premier is Penrith, dethroning Melbourne on the weekend just gone. The UNRLP has changed hands each week since Souths lost it in round 19.
5. What happens to defending champs next year?
Famously, no team has won back to back NRL premierships but how did they actually go in their defending year?

The 2002 Roosters and the 2007 Storm* came closest to back-to-back titles, finishing runners-up in the years after their premiership wins. The 2018 Storm are an outside chance of backing up for a second premiership in as many years, with the Finals Stocky rating them 10% at the moment.
Only three teams missed the finals altogether: the 2005 Bulldogs, 2006 Tigers and the 2010 Storm. That there is not much evidence for a significant premiership hangover in the NRL was made clear in this post earlier in the year.
Interestingly, we see almost all of the defending premiers regressing towards mean – that is, the league’s average of twelve wins or a .500 winning percentage – in the following season. Only the 2002 Knights and 2003 Roosters had more regular season wins than in their premiership year and the 2009 Storm managed the same number of “wins” in 2010 but obviously didn’t play finals that year being too busy with an NRL-mandated wooden spoon. On average, ignoring the ’97 premiers, the defending premiers lose 2.6 more games in the next year.
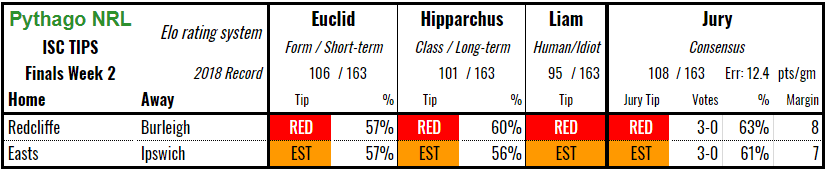
6. Week 1 tips
I won’t be here to update through the finals but the tipping gets less interesting with fewer games available anyway. Here’s what this week looks like: