Last year, I did a report on each NRL club featuring a bit of history, a few statistics and some graphs. The series didn’t do super well in terms of clicks but also didn’t take a lot of effort to produce.
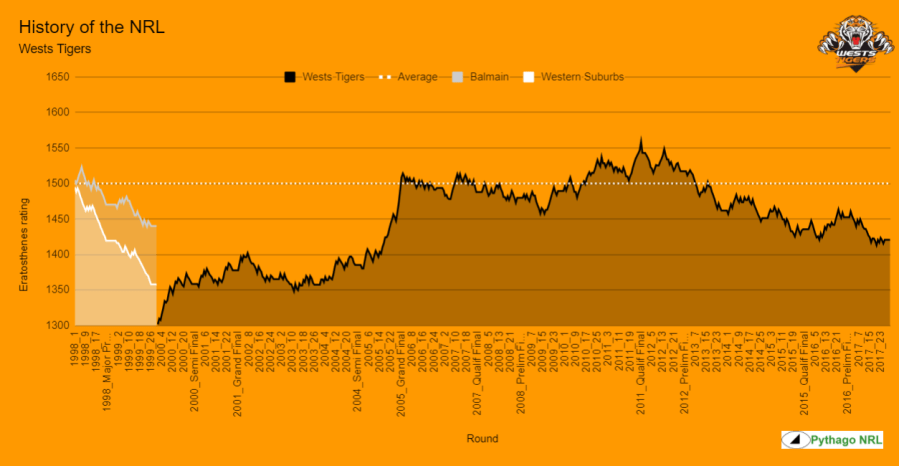
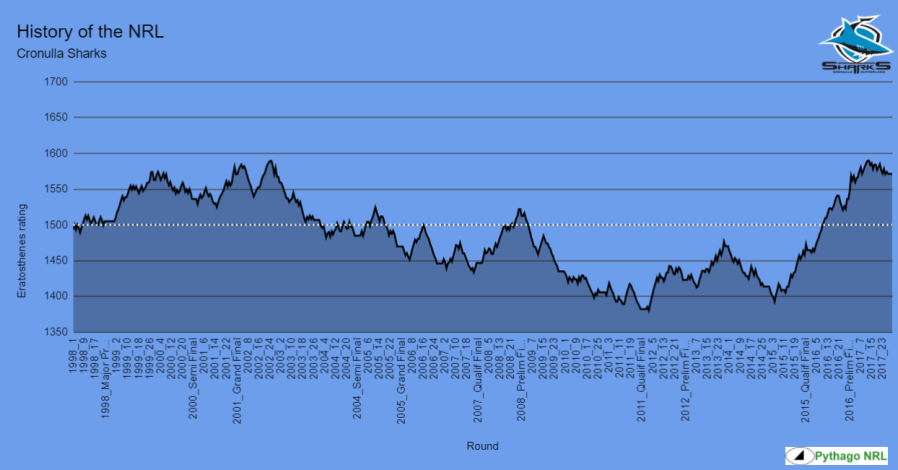
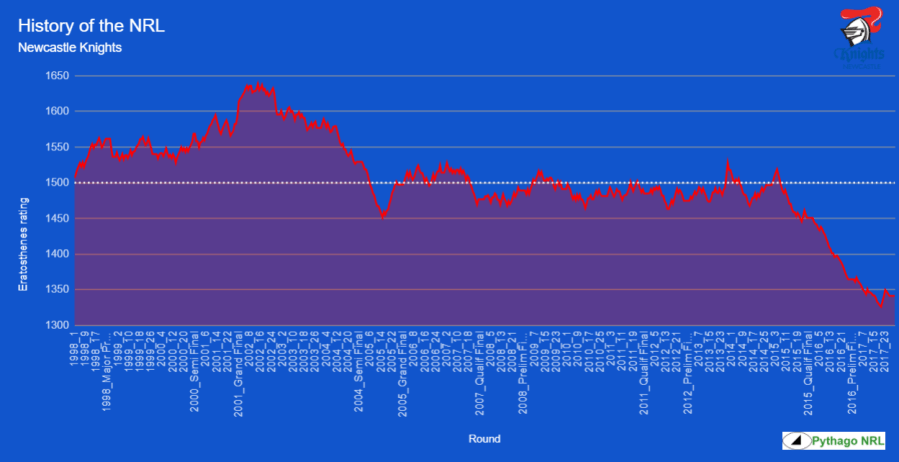
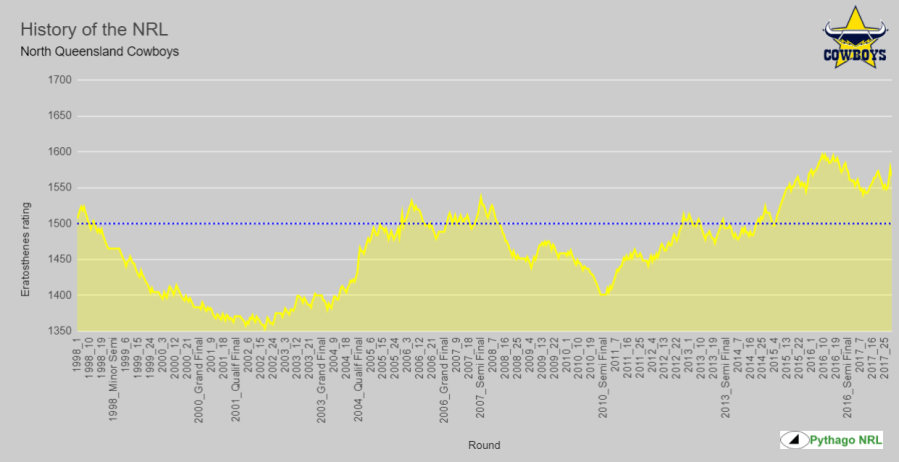
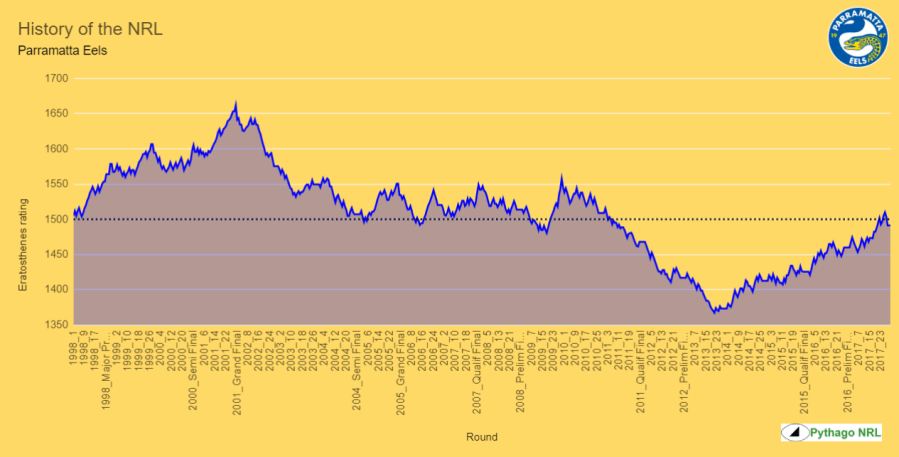
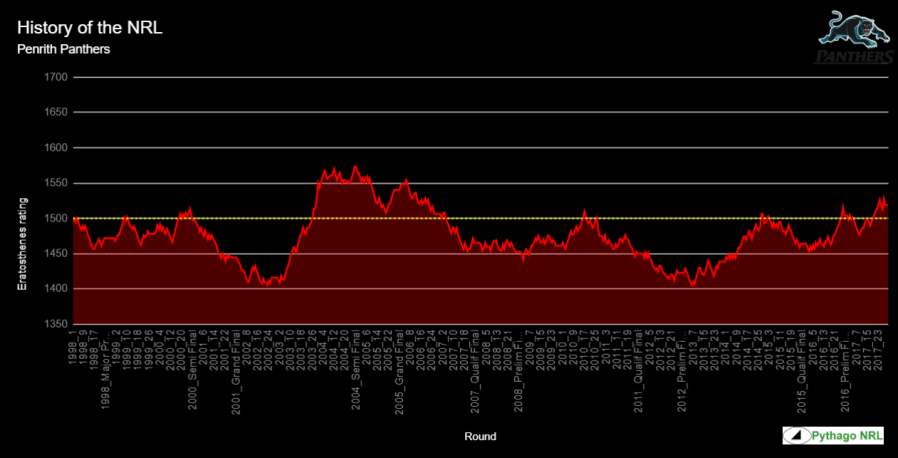
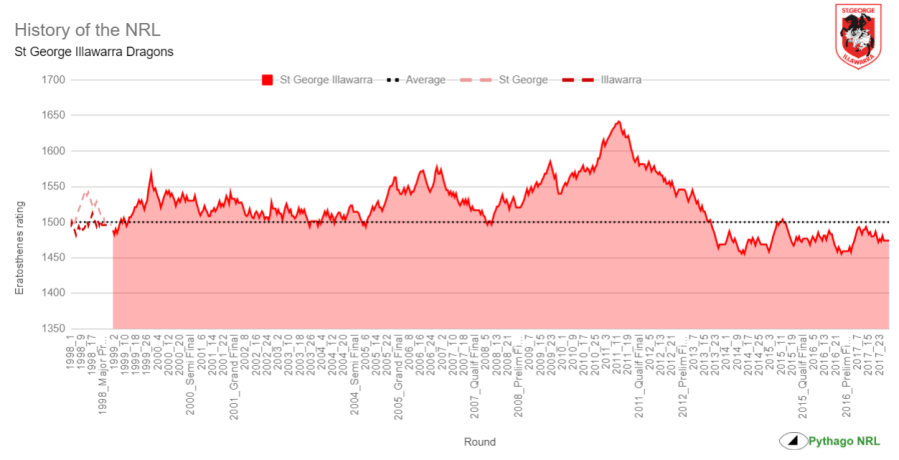
One thing I did enjoy putting together were the class graphs. These use a slow moving Elo rating system called Eratosthenes to track the long term performance of clubs. You can see a full listing of all current ratings here.
If you’ve got the right kind of stuff between your ears (that is, if you’re a massive nerd), each picture tells each team’s thousands of words history in the NRL. To that end, I’ve updated all sixteen clubs’ graphs to the end of the 2017 season for your nerdy consumption.
Jump ahead
 Brisbane Broncos
 Canberra Raiders
 Canterbury Bulldogs
 Cronulla Sharks
 Gold Coast Titans
 Manly Sea Eagles
 Melbourne Storm
 Newcastle Knights
 New Zealand Warriors
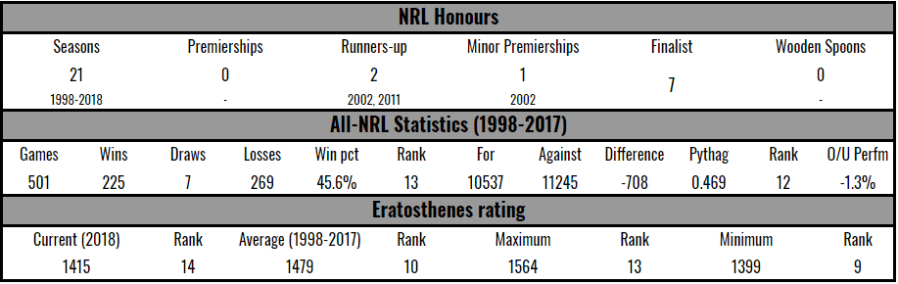
 North Queensland Cowboys
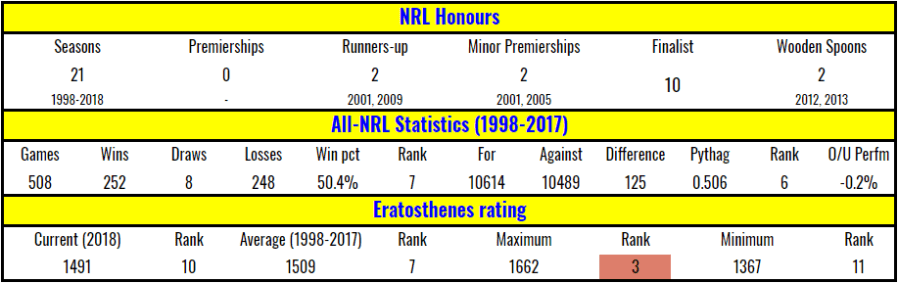
 Parramatta Eels
 Penrith Panthers
 South Sydney Rabbitohs
 St George Illawarra Dragons
 Sydney Roosters
 Wests Tigers
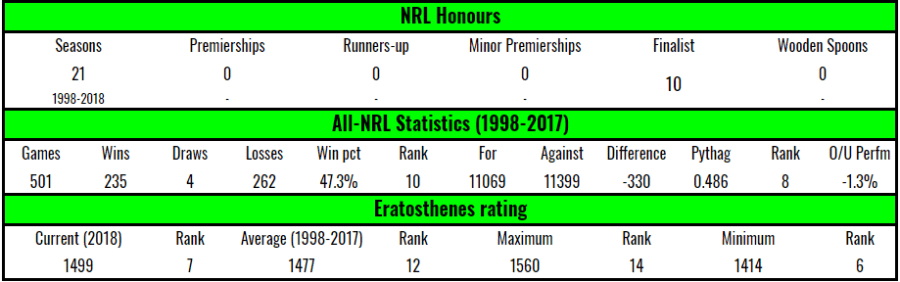
Brisbane Broncos


Canberra Raiders

Canterbury Bulldogs

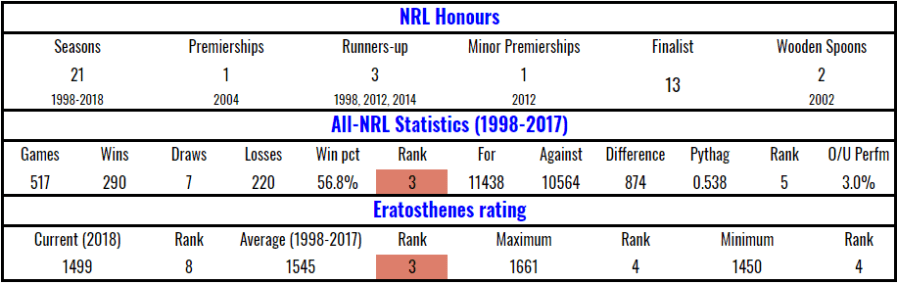
Cronulla Sharks

Gold Coast Titans


Manly Sea Eagles


*Manly’s ill-fated merger with North Sydney, as the Northern Eagles, lasted from 2000 to 2002. The Eagles’ stats are included as part of Manly’s history.
Melbourne Storm

Melbourne were famously stripped of the 2007 and 2009 premierships and the 2006, 2007 and 2008 minor premierships for salary cap breaches uncovered in 2010. They were stripped of all competition points for that season.
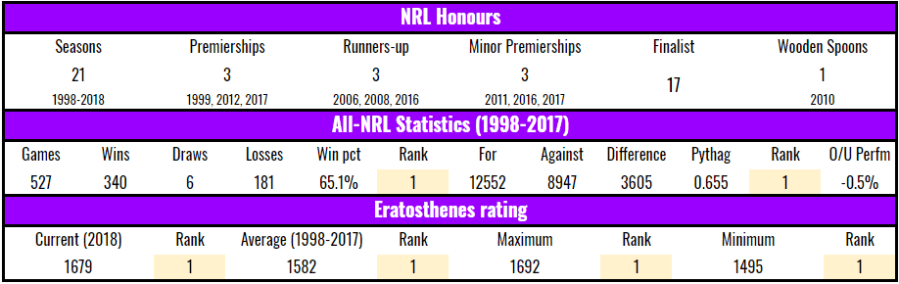
Newcastle Knights
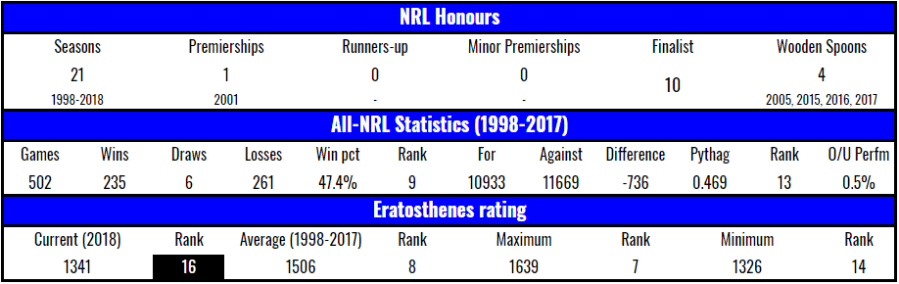
New Zealand Warriors
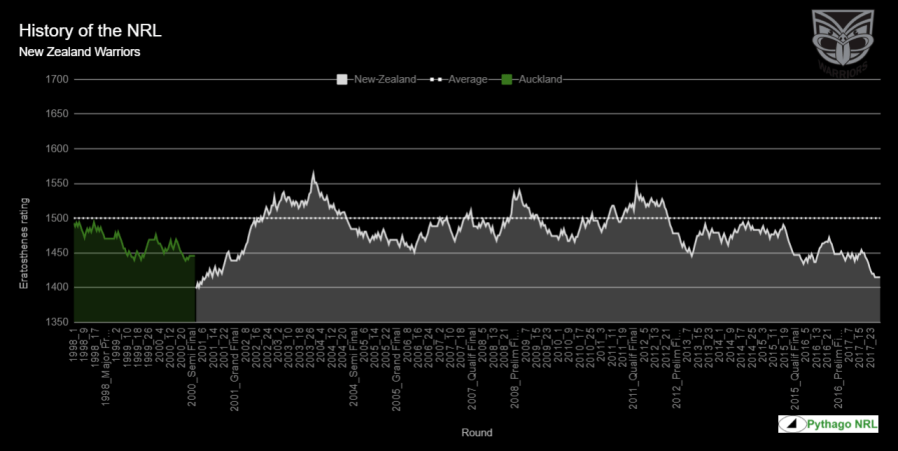
The statistics accumulated as the Auckland Warriors are incorporated into the New Zealand Warriors’ stats.
North Queensland Cowboys

Parramatta Eels
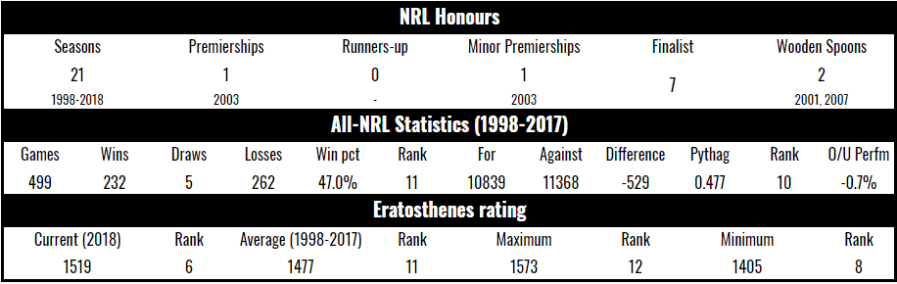
Penrith Panthers
South Sydney Rabbitohs


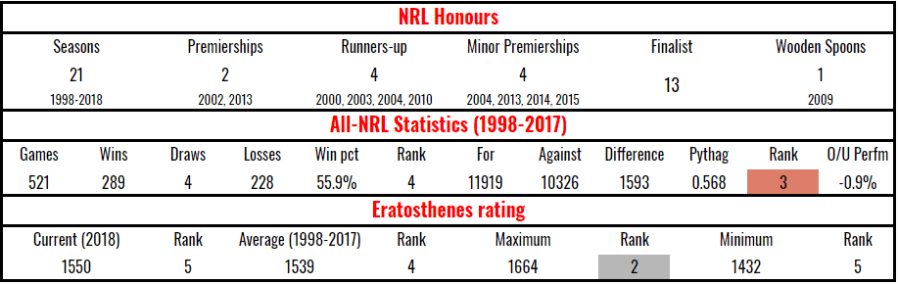
St George Illawarra Dragons

Sydney Roosters

Wests Tigers